
class anychart.charts.Waterfall Improve this Doc
Extends: anychart.core.SeparateChart
Waterfall chart class.
To get the chart use these method:
Methods Overview
| Specific settings | |
| annotations() | Creates annotations. |
| getType() | Definition of the chart type. |
| globalToLocal() | Converts the global coordinates to local coordinates. |
| localToGlobal() | Converts the local coordinates to global coordinates. |
| Axes and Scales | |
| getXAxesCount() | Returns the number of X-axes. |
| getXScales() | Returns chart X scales. |
| getYAxesCount() | Returns the number of Y-axes. |
| getYScales() | Returns chart Y scales. |
| grid() | Grid settings. |
| lineMarker() | Line marker settings. |
| minorGrid() | Minor grid settings. |
| rangeMarker() | Range marker settings. |
| textMarker() | Text marker settings. |
| xAxis() | X-axis settings. |
| xScale() | X-scale settings. |
| yAxis() | Y-axis settings. |
| yScale() | Y-scale settings. |
| Chart Coloring | |
| background() | Background settings. |
| hatchFillPalette() | Hatch fill palette settings. |
| markerPalette() | Markers palette settings. |
| palette() | Palette settings. |
| Chart Controls | |
| contextMenu() | Context menu settings. |
| credits() | Credits settings |
| label() | Label settings. |
| legend() | Legend settings. |
| title() | Title settings. |
| xScroller() | Scroller settings. |
| Coloring | |
| connectorStroke() | Stroke settings. |
| Data | |
| data() | Data settings. |
| dataMode() | Data mode settings. |
| getStat() | Getter for a statistical value by the key. |
| Events | |
| listen() | Adds an event listener. |
| listenOnce() | Adds a single time event listener. |
| removeAllListeners() | Removes all listeners. |
| unlisten() | Removes the listener. |
| unlistenByKey() | Removes the listener by the key. |
| Export | |
| print() | Prints all elements. |
| saveAsCsv() | Saves chart data as CSV file. |
| saveAsJson() | Saves chart config as JSON document. |
| saveAsXlsx() | Saves chart data as Excel document. |
| saveAsXml() | Saves chart config as XML document. |
| toCsv() | Returns CSV string with series data. |
| Interactivity | |
| crosshair() | Crosshair settings. |
| interactivity() | Interactivity settings. |
| tooltip() | Tooltip settings. |
| xZoom() | Zoom settings. |
| Point Elements | |
| labels() | Labels settings. |
| Size and Position | |
| bottom() | Bottom bound setting. |
| bounds() | Bounds settings. |
| getPixelBounds() | Returns pixel bounds. |
| getPlotBounds() | Returns data bounds of the chart. |
| height() | Height setting. |
| left() | Left bound setting. |
| margin() | Margin settings. |
| maxHeight() | Maximum height. |
| maxWidth() | Maximum width. |
| minHeight() | Minimum height. |
| minWidth() | Minimum width. |
| padding() | Padding settings. |
| right() | Right bound setting. |
| top() | Top bound setting. |
| width() | Width setting. |
| zIndex() | Z-index of the element. |
| Specific Series Settings | |
| addSeries() | Adds series to the chart. |
| getSeries() | Returns series by id. |
| getSeriesAt() | Returns series by index. |
| getSeriesCount() | Returns the number of series in a chart. |
| removeAllSeries() | Removes all series from chart. |
| removeSeries() | Removes one of series from chart by its id. |
| removeSeriesAt() | Removes one of series from chart by its index. |
| XML/JSON | |
| toJson() | Return chart configuration as JSON object or string. |
| toXml() | Return chart configuration as XML string or XMLNode. |
| Miscellaneous | |
| container() | Getter for the element's container. |
| draw() | Drawing of the chart. |
| saveAsJpg() | Saves the current chart as JPEG image. |
| saveAsPdf() | Saves the current chart as PDF image. |
| saveAsPng() | Saves the current chart as PNG image. |
| saveAsSvg() | Saves the current chart as SVG image. |
| toSvg() | Returns SVG string. |
Methods Description
addSeries
Params:
| Name | Type | Description |
|---|---|---|
| var_args | anychart.data.View | anychart.data.Set | Array | Chart series data. |
Returns:
Array.<anychart.core.cartesian.series.Base> - Array of created series.Try it:
annotations
Returns:
anychart.core.annotations.PlotController - The plot annotations.Try it:
Params:
| Name | Type | Description |
|---|---|---|
| annotationsList | Array | Annotations list to set. |
Returns:
anychart.charts.Waterfall - Self instance for method chainingTry it:
background
Returns:
anychart.core.ui.Background - The current chart background.Try it:
Params:
| Name | Type | Default | Description |
|---|---|---|---|
| value | Object | {enabled: true, fill: "#fff", stroke: 'none', zIndex: 1} | Background object to set. |
Returns:
anychart.charts.Waterfall - Self instance for method chaining.Try it:
bottom
Returns:
number | string | undefined - Current element's bottom bound setting.Params:
| Name | Type | Default | Description |
|---|---|---|---|
| value | number | string | null | null | Bottom bound setting for the element. |
Returns:
anychart.charts.Waterfall - Returns self for method chaining.Try it:
bounds
Returns:
anychart.core.utils.Bounds - Current bounds of the element.Params:
| Name | Type | Description |
|---|---|---|
| value | anychart.utils.RectObj | anychart.math.Rect | anychart.core.utils.Bounds | Bounds of element. |
Returns:
anychart.charts.Waterfall - Self instance for method chaining.Try it:
Params:
| Name | Type | Default | Description |
|---|---|---|---|
| x | number | string | null | X-coordinate. |
| y | number | string | null | Y-coordinate. |
| width | number | string | null | Width. |
| height | number | string | null | Height. |
Returns:
anychart.charts.Waterfall - Self instance for method chaining.Try it:
connectorStroke
Returns:
anychart.graphics.vector.Stroke - Stroke settings.var connectorStroke = chart.connectorStroke();
Params:
| Name | Type | Default | Description |
|---|---|---|---|
| color | anychart.graphics.vector.Stroke | anychart.graphics.vector.ColoredFill | string | null | Stroke settings. | |
| thickness | number | 1 | Line thickness. |
| dashpattern | string | Controls the pattern of dashes and gaps used to stroke paths. | |
| lineJoin | anychart.graphics.vector.StrokeLineJoin | Line joint style. | |
| lineCap | anychart.graphics.vector.StrokeLineCap | Line cap style. |
Returns:
anychart.charts.Waterfall - Self instance for method chaining.Try it:
container
The order of adding is not defined, but usually it will be the order in which elements are drawn for the first time. If you need to specify the order use anychart.core.VisualBase#zIndex.
Params:
| Name | Type | Description |
|---|---|---|
| value | anychart.graphics.vector.Layer | anychart.graphics.vector.Stage | string | Element | The value to set. |
Returns:
anychart.charts.Waterfall - Self instance for method chaining.// string
element.container('containerIdentifier');
// DOM-element
var domElement = document.getElementById('containerIdentifier');
element.container(domElement);
// Framework-element
var fwElement = anychart.standalones.title();
element.container( fwElement.container() );Try it:
contextMenu
Returns:
anychart.ui.ContextMenu - The current context menu.Try it:
- null/boolean - disable or enable context menu.
- object - sets context menu settings.
Params:
| Name | Type | Description |
|---|---|---|
| value | Object | boolean | null | Context menu settings |
Returns:
anychart.charts.Waterfall - Self instance for method chaining.credits
Sets chart credits settings depending on parameter type:
- null/boolean - disable or enable chart credits.
- object - sets chart credits settings.
Params:
| Name | Type | Default | Description |
|---|---|---|---|
| value | Object | boolean | null | true | Credits settings |
Returns:
anychart.charts.Waterfall - An instance of the class for method chaining.crosshair
- null/boolean - disable or enable chart crosshair.
- object - sets chart crosshair settings.
Params:
| Name | Type | Default | Description |
|---|---|---|---|
| value | Object | boolean | null | false | Crosshair settings. |
Returns:
anychart.charts.Waterfall - Self instance for method chaining.data
Params:
| Name | Type | Description |
|---|---|---|
| value | anychart.data.Set | anychart.data.DataSettings | Array | Value to set |
Returns:
anychart.charts.Waterfall - Self instance for method chaining.dataMode
Returns:
anychart.enums.WaterfallDataMode | string - Data mode.var dataMode = chart.dataMode();
Params:
| Name | Type | Default | Description |
|---|---|---|---|
| value | string | anychart.enums.WaterfallDataMode | "diff" | Data mode. |
Returns:
anychart.charts.Waterfall - Self instance for method chaining.Try it:
draw
Params:
| Name | Type | Description |
|---|---|---|
| async | boolean | Whether do draw asynchronously. If set to true, the chart will be drawn asynchronously. |
Returns:
anychart.charts.Waterfall - Self instance for method chaining.getPixelBounds
Returns:
anychart.math.Rect - Pixel bounds of the element.getPlotBounds
Note: Works only after anychart.charts.Waterfall#draw is called.
Returns:
anychart.math.Rect - Data bounds of the chart.Try it:
getSeries
Params:
| Name | Type | Default | Description |
|---|---|---|---|
| id | number | string | index | Id of the series. |
Returns:
anychart.core.waterfall.series.Waterfall - An instance of the created series.Try it:
getSeriesAt
Params:
| Name | Type | Description |
|---|---|---|
| index | number | Index of the series. |
Returns:
anychart.core.cartesian.series.Base - An instance of the created series.Try it:
getSeriesCount
getStat
Params:
| Name | Type | Description |
|---|---|---|
| key | string | anychart.enums.Statistics | Key. |
Returns:
* - Statistics value.Try it:
getType
getXAxesCount
Returns:
number - Number of X-axes.getXScales
Returns:
Array - An array of all X scales (including axes, grids, and axis markers scales).getYAxesCount
Returns:
number - Number of Y-axes.getYScales
Returns:
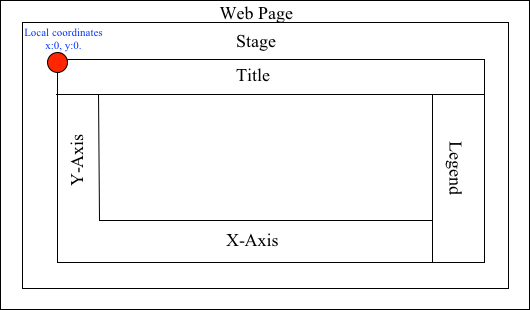
Array - An array of all Y scales (including axes, grids, and axis markers scales).globalToLocal
On image below, the red point is a starting coordinate point of the chart bounds. Local coordinates work only in area of the stage (container).
Params:
| Name | Type | Description |
|---|---|---|
| xCoord | number | Global X coordinate. |
| yCoord | number | Global Y coordinate. |
Returns:
Object.<string, number> - Object with XY coordinates.Try it:
grid
Params:
| Name | Type | Default | Description |
|---|---|---|---|
| index | number | 0 | Chart grid index. If don't set - creates a new instance and adds it to the end of array. |
Returns:
anychart.core.grids.Linear - Grid instance by index.Try it:
- null/boolean - disable or enable chart grid.
- object - sets chart grid settings.
Params:
| Name | Type | Default | Description |
|---|---|---|---|
| value | Object | boolean | null | false | Chart grid settings to set. |
Returns:
anychart.charts.Waterfall - Self instance for method chaining.- null/boolean - disable or enable chart grid by index.
- object - sets chart grid settings by index.
Params:
| Name | Type | Default | Description |
|---|---|---|---|
| index | number | 0 | Chart grid index. |
| value | Object | boolean | null | false | Chart grid settings to set. |
Returns:
anychart.charts.Waterfall - Self instance for method chaining.hatchFillPalette
Returns:
anychart.palettes.HatchFills - Chart hatch fill palette.var hatchFillPalette = chart.hatchFillPalette();
Params:
| Name | Type | Description |
|---|---|---|
| value | Array.<anychart.graphics.vector.HatchFill.HatchFillType> | Object | anychart.palettes.HatchFills | Chart hatch fill palette settings to set. |
Returns:
anychart.charts.Waterfall - Self instance for method chaining.Try it:
height
Returns:
number | string | undefined - Current element's height setting.Params:
| Name | Type | Default | Description |
|---|---|---|---|
| value | number | string | null | null | Height setting for the element. |
Returns:
anychart.charts.Waterfall - Returns self for method chaining.Try it:
interactivity
Returns:
anychart.core.utils.Interactivity - The current interactivity settings.Params:
| Name | Type | Description |
|---|---|---|
| value | Object | anychart.enums.HoverMode | Settings object or boolean value like enabled state. |
Returns:
anychart.charts.Waterfall - Self instance for method chaining.Try it:
label
Params:
| Name | Type | Default | Description |
|---|---|---|---|
| index | string | number | 0 | Index of instance. |
Returns:
anychart.core.ui.Label - An instance of class.Try it:
- null/boolean - disable or enable chart label.
- string - sets chart label text value.
- object - sets chart label settings.
Params:
| Name | Type | Default | Description |
|---|---|---|---|
| value | null | boolean | Object | string | false | Chart label instance to add by index 0. |
Returns:
anychart.charts.Waterfall - Self instance for method chaining.- null/boolean - disable or enable chart label.
- string - sets chart label text value.
- object - sets chart label settings.
Params:
| Name | Type | Default | Description |
|---|---|---|---|
| index | string | number | Label index. | |
| value | null | boolean | Object | string | false | Chart label settings. |
Returns:
anychart.charts.Waterfall - Self instance for method chaining.labels
- null/boolean - disable or enable point labels.
- object - sets point labels settings.
Params:
| Name | Type | Description |
|---|---|---|
| value | Object | boolean | null | Point labels settings. |
Returns:
anychart.charts.Waterfall - Self instance for method chaining.left
Returns:
number | string | undefined - Current element's left bound setting.Params:
| Name | Type | Default | Description |
|---|---|---|---|
| value | number | string | null | null | Left bound setting for the element. |
Returns:
anychart.charts.Waterfall - Returns self for method chaining.Try it:
legend
Returns:
anychart.core.ui.Legend - An instance of the class for method chaining.Try it:
- null/boolean - disable or enable chart legend.
- object - sets chart legend settings.
Params:
| Name | Type | Default | Description |
|---|---|---|---|
| value | Object | boolean | null | false | Legend settings. |
Returns:
anychart.charts.Waterfall - An instance of the class for method chaining.lineMarker
Params:
| Name | Type | Default | Description |
|---|---|---|---|
| index | number | 0 | Chart line marker index. If don't set - creates a new instance and adds it to the end of array. |
Returns:
anychart.core.axisMarkers.Line - Line marker instance by index.Try it:
- null/boolean - disable or enable chart line marker.
- object - sets chart line marker settings.
Params:
| Name | Type | Default | Description |
|---|---|---|---|
| value | Object | boolean | null | false | Chart line marker settings to set. |
Returns:
anychart.charts.Waterfall - Self instance for method chaining.- null/boolean - disable or enable chart line marker by index.
- object - sets chart line marker settings by index.
Params:
| Name | Type | Default | Description |
|---|---|---|---|
| index | number | 0 | Chart line marker index. |
| value | Object | boolean | null | Chart line marker settings to set. |
Returns:
anychart.charts.Waterfall - Self instance for method chaining.listen
Note Notice that if the existing listener is one-off (added using listenOnce), it will cease to be such after calling the listen() method.
Params:
| Name | Type | Default | Description |
|---|---|---|---|
| type | string | The event type id. | |
| listener | function | Callback method. Function that looks like function(event){
// event.actualTarget - actual event target
// event.currentTarget - current event target
// event.iterator - event iterator
// event.originalEvent - original event
// event.point - event point
// event.pointIndex - event point index
}. | |
| useCapture | boolean | false | Whether to fire in capture phase. Learn more about capturing https://javascript.info/bubbling-and-capturing |
| listenerScope | Object | Object in whose scope to call the listener. |
Returns:
Object - Unique key for the listener.Try it:
listenOnce
If the event handler being added already exists, listenOnce will do nothing.
Note In particular, if the handler is already registered using listen(), listenOnce() will not make it one-off. Similarly, if a one-off listener already exists, listenOnce will not change it (it wil remain one-off).
Params:
| Name | Type | Default | Description |
|---|---|---|---|
| type | string | The event type id. | |
| listener | function | Callback method. | |
| useCapture | boolean | false | Whether to fire in capture phase. Learn more about capturing https://javascript.info/bubbling-and-capturing |
| listenerScope | Object | Object in whose scope to call the listener. |
Returns:
Object - Unique key for the listener.Try it:
localToGlobal
On image below, the red point is a starting coordinate point of the chart bounds. Local coordinates work only in area of the stage (container).
Params:
| Name | Type | Description |
|---|---|---|
| xCoord | number | Local X coordinate. |
| yCoord | number | Local Y coordinate. |
Returns:
Object.<string, number> - Object with XY coordinates.Try it:
margin
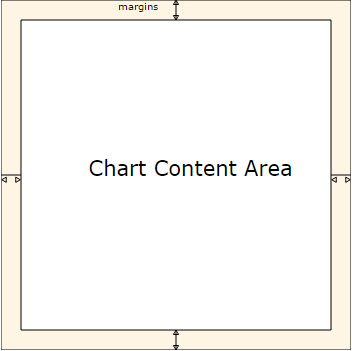
Returns:
anychart.core.utils.Margin - Chart margin.Try it:
Params:
| Name | Type | Default | Description |
|---|---|---|---|
| value | Array.<(number|string)> | Object | {top: 0, right: 0, bottom: 0, left: 0} | Value to set. |
Returns:
anychart.charts.Waterfall - Self instance for method chaining.// all margins 15px
chart.margin(15);
// all margins 15px
chart.margin("15px");
// top and bottom 5px, right and left 15px
chart.margin(anychart.utils.margin(5, 15));Try it:
Params:
| Name | Type | Default | Description |
|---|---|---|---|
| value1 | string | number | 0 | Top or top-bottom space. |
| value2 | string | number | 0 | Right or right-left space. |
| value3 | string | number | 0 | Bottom space. |
| value4 | string | number | 0 | Left space. |
Returns:
anychart.charts.Waterfall - Self instance for method chaining.// 1) all 10px chart.margin(10); // 2) top and bottom 10px, left and right 15px chart.margin(10, "15px"); // 3) top 10px, left and right 15px, bottom 5px chart.margin(10, "15px", 5); // 4) top 10px, right 15px, bottom 5px, left 12px chart.margin(10, "15px", "5px", 12);
Try it:
markerPalette
Returns:
anychart.palettes.Markers - Chart markers palette.var markerPalette = chart.markerPalette();
Params:
| Name | Type | Description |
|---|---|---|
| value | anychart.palettes.Markers | Object | Array.<anychart.enums.MarkerType> | Chart marker palette settings to set. |
Returns:
anychart.charts.Waterfall - Self instance for method chaining.Try it:
maxHeight
Returns:
number | string | null - Current element's maximum height.Params:
| Name | Type | Default | Description |
|---|---|---|---|
| value | number | string | null | null | Value to set. |
Returns:
anychart.charts.Waterfall - Self instance for method chaining.Try it:
maxWidth
Returns:
number | string | null - Current element's maximum width.Params:
| Name | Type | Default | Description |
|---|---|---|---|
| value | number | string | null | null | Value to set. |
Returns:
anychart.charts.Waterfall - Self instance for method chaining.Try it:
minHeight
Returns:
number | string | null - Current element's minimum height.Params:
| Name | Type | Default | Description |
|---|---|---|---|
| value | number | string | null | null | Value to set. |
Returns:
anychart.charts.Waterfall - Self instance for method chaining.Try it:
minWidth
Returns:
number | string | null - Current element's minimum width.Params:
| Name | Type | Default | Description |
|---|---|---|---|
| value | number | string | null | null | Value to set. |
Returns:
anychart.charts.Waterfall - Self instance for method chaining.Try it:
minorGrid
Params:
| Name | Type | Default | Description |
|---|---|---|---|
| index | number | 0 | Chart minor grid index. If don't set - creates a new instance and adds it to the end of array. |
Returns:
anychart.core.grids.Linear - Minor grid instance by index.Try it:
- null/boolean - disable or enable chart minor grid.
- object - sets chart minor grid settings.
Params:
| Name | Type | Default | Description |
|---|---|---|---|
| value | Object | boolean | null | false | Chart minor grid settings to set. |
Returns:
anychart.charts.Waterfall - Self instance for method chaining.- null/boolean - disable or enable chart minor grid by index.
- object - sets chart minor grid settings by index.
Params:
| Name | Type | Default | Description |
|---|---|---|---|
| index | number | 0 | Chart minor grid index. |
| value | Object | boolean | null | false | Chart minor grid settings to set. |
Returns:
anychart.charts.Waterfall - Self instance for method chaining.padding
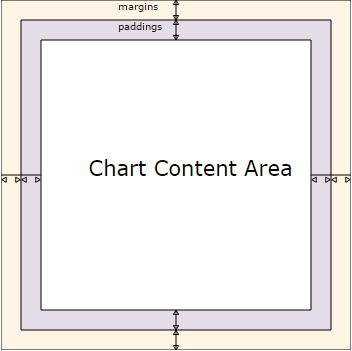
Returns:
anychart.core.utils.Padding - Chart padding.Try it:
Params:
| Name | Type | Default | Description |
|---|---|---|---|
| value | Array.<(number|string)> | Object | {top: 0, right: 0, bottom: 0, left: 0} | Value to set. |
Returns:
anychart.charts.Waterfall - Self instance for method chaining.chart.padding([5, 15]);
or
chart.padding({left: 10, top: 20, bottom: 30, right: "40%"}});Try it:
Params:
| Name | Type | Default | Description |
|---|---|---|---|
| value1 | string | number | 0 | Top or top-bottom space. |
| value2 | string | number | 0 | Right or right-left space. |
| value3 | string | number | 0 | Bottom space. |
| value4 | string | number | 0 | Left space. |
Returns:
anychart.charts.Waterfall - Self instance for method chaining.// 1) all 10px chart.padding(10); // 2) top and bottom 10px, left and right 15px chart.padding(10, "15px"); // 3) top 10px, left and right 15px, bottom 5px chart.padding(10, "15px", 5); // 4) top 10px, right 15%, bottom 5px, left 12px chart.padding(10, "15%", "5px", 12);
Try it:
palette
var palette = chart.palette();
Params:
| Name | Type | Description |
|---|---|---|
| value | anychart.palettes.RangeColors | anychart.palettes.DistinctColors | Object | Array.<string> | Series colors palette settings to set. |
Returns:
anychart.charts.Waterfall - Self instance for method chaining.Params:
| Name | Type | Default | Description |
|---|---|---|---|
| paperSizeOrOptions | anychart.graphics.vector.PaperSize | Object | Paper size or object with options. | |
| landscape | boolean | false | Flag of landscape. |
Try it:
rangeMarker
Params:
| Name | Type | Default | Description |
|---|---|---|---|
| index | number | 0 | Chart range marker index. If don't set - creates a new instance and adds it to the end of array. |
Returns:
anychart.core.axisMarkers.Range - Range marker instance by index.Try it:
- null/boolean - disable or enable chart range marker.
- object - sets chart range marker settings.
Params:
| Name | Type | Default | Description |
|---|---|---|---|
| value | Object | boolean | null | false | Chart range marker settings to set. |
Returns:
anychart.charts.Waterfall - Self instance for method chaining.- null/boolean - disable or enable chart range marker by index.
- object - sets chart range marker settings by index.
Params:
| Name | Type | Default | Description |
|---|---|---|---|
| index | number | 0 | Chart range marker index. |
| value | Object | boolean | null | Chart range marker settings to set. |
Returns:
anychart.charts.Waterfall - Self instance for method chaining.removeAllListeners
Params:
| Name | Type | Description |
|---|---|---|
| type | string | Type of event to remove, default is to remove all types. |
Returns:
number - Number of listeners removed.Try it:
removeAllSeries
Returns:
anychart.charts.Waterfall - Self instance for method chaining.Try it:
removeSeries
Params:
| Name | Type | Description |
|---|---|---|
| id | number | string | Series id. |
Returns:
anychart.charts.Waterfall - Self instance for method chaining.Try it:
removeSeriesAt
Params:
| Name | Type | Description |
|---|---|---|
| index | number | Series index. |
Returns:
anychart.charts.Waterfall - Self instance for method chaining.Try it:
right
Returns:
number | string | undefined - Current element's right bound setting.Params:
| Name | Type | Default | Description |
|---|---|---|---|
| value | number | string | null | null | Right bound setting for the element. |
Returns:
anychart.charts.Waterfall - Returns self for method chaining.Try it:
saveAsCsv
Params:
| Name | Type | Description |
|---|---|---|
| chartDataExportMode | string | anychart.enums.ChartDataExportMode | Data export mode. |
| csvSettings | Object.<string, (string|boolean|undefined)> | CSV settings. |
| filename | string | File name to save. |
Try it:
saveAsJpg
Params:
| Name | Type | Description |
|---|---|---|
| width | number | Object | Image width or object with options. |
| height | number | Image height. |
| quality | number | Image quality in ratio 0-1. |
| forceTransparentWhite | boolean | Force transparent to white or not. |
| filename | string | File name to save. |
Try it:
saveAsJson
Params:
| Name | Type | Description |
|---|---|---|
| includeTheme | boolean | If the current theme properties should be included into the result. |
| filename | string | File name to save. |
Try it:
saveAsPdf
Params:
| Name | Type | Description |
|---|---|---|
| paperSizeOrWidthOrOptions | number | string | Object | Any paper format like 'a0', 'tabloid', 'b4', etc or width, or object with options. |
| landscape | boolean | Define, is landscape. |
| x | number | Offset X. |
| y | number | Offset Y. |
| filename | string | File name to save. |
Try it:
saveAsPng
Params:
| Name | Type | Description |
|---|---|---|
| width | number | Object | Image width or object with options. |
| height | number | Image height. |
| quality | number | Image quality in ratio 0-1. |
| filename | string | File name to save. |
Try it:
saveAsSvg
Params:
| Name | Type | Description |
|---|---|---|
| paperSize | string | Object | Paper Size or object with options. |
| landscape | boolean | Landscape. |
| filename | string | File name to save. |
Try it:
Params:
| Name | Type | Description |
|---|---|---|
| width | number | Image width. |
| height | number | Image height. |
Try it:
saveAsXlsx
Params:
| Name | Type | Description |
|---|---|---|
| chartDataExportMode | string | anychart.enums.ChartDataExportMode | Data export mode. |
| filename | string | File name to save. |
Try it:
saveAsXml
Params:
| Name | Type | Description |
|---|---|---|
| includeTheme | boolean | If the current theme properties should be included into the result. |
| filename | string | File name to save. |
Try it:
textMarker
Params:
| Name | Type | Default | Description |
|---|---|---|---|
| index | number | 0 | Chart text marker index. If don't set - creates a new instance and adds it to the end of array. |
Returns:
anychart.core.axisMarkers.Text - Text marker instance by index.Try it:
- null/boolean - disable or enable chart text marker.
- object - sets chart text marker settings.
Params:
| Name | Type | Default | Description |
|---|---|---|---|
| value | Object | boolean | null | false | Chart text marker settings to set. |
Returns:
anychart.charts.Waterfall - Self instance for method chaining.- null/boolean - disable or enable chart text marker by index.
- object - sets chart text marker settings by index.
Params:
| Name | Type | Default | Description |
|---|---|---|---|
| index | number | 0 | Chart text marker index. |
| value | Object | boolean | null | Chart text marker settings to set. |
Returns:
anychart.charts.Waterfall - Self instance for method chaining.title
- null/boolean - disable or enable chart title.
- string - sets chart title text value.
- object - sets chart title settings.
Params:
| Name | Type | Default | Description |
|---|---|---|---|
| value | null | boolean | Object | string | false | Chart title text or title instance for copy settings from. |
Returns:
anychart.charts.Waterfall - Self instance for method chaining.toCsv
Params:
| Name | Type | Description |
|---|---|---|
| chartDataExportMode | string | anychart.enums.ChartDataExportMode | Data export mode. |
| csvSettings | Object.<string, (string|boolean|undefined)> | CSV settings. |
Returns:
string - CSV string.Try it:
toJson
Params:
| Name | Type | Default | Description |
|---|---|---|---|
| stringify | boolean | false | Returns JSON as string. |
| includeTheme | boolean | false | If the current theme properties should be included into the result. |
Returns:
Object | string - Chart configuration.toSvg
Params:
| Name | Type | Description |
|---|---|---|
| paperSize | string | Object | Paper Size or object of options. |
| landscape | boolean | Landscape. |
Returns:
string - SVG content or empty string.Try it:
Params:
| Name | Type | Description |
|---|---|---|
| width | number | Image width. |
| height | number | Image height. |
Returns:
string - SVG content or empty string.Try it:
toXml
Params:
| Name | Type | Default | Description |
|---|---|---|---|
| asXmlNode | boolean | false | Return XML as XMLNode. |
| includeTheme | boolean | false | If the current theme properties should be included into the result. |
Returns:
string | Node - Chart configuration.tooltip
Returns:
anychart.core.ui.Tooltip - An instance of the class for method chaining.var tooltipSettings = chart.tooltip();
- null/boolean - disable or enable tooltip.
- object - sets tooltip settings.
Params:
| Name | Type | Description |
|---|---|---|
| value | Object | boolean | null |
Returns:
anychart.charts.Waterfall - Self instance for method chaining.top
Returns:
number | string | undefined - Current element's top bound setting.Params:
| Name | Type | Default | Description |
|---|---|---|---|
| value | number | string | null | null | Top bound setting for the element. |
Returns:
anychart.charts.Waterfall - Returns self for method chaining.Try it:
unlisten
Params:
| Name | Type | Default | Description |
|---|---|---|---|
| type | string | The event type id. | |
| listener | function | Callback method. | |
| useCapture | boolean | false | Whether to fire in capture phase. Learn more about capturing https://javascript.info/bubbling-and-capturing |
| listenerScope | Object | Object in whose scope to call the listener. |
Returns:
boolean - Whether any listener was removed.Try it:
unlistenByKey
Params:
| Name | Type | Description |
|---|---|---|
| key | Object | The key returned by listen() or listenOnce(). |
Returns:
boolean - Whether any listener was removed.Try it:
width
Returns:
number | string | undefined - Current element's width setting.Params:
| Name | Type | Default | Description |
|---|---|---|---|
| value | number | string | null | null | Width setting for the element. |
Returns:
anychart.charts.Waterfall - Returns self for method chaining.Try it:
xAxis
Params:
| Name | Type | Default | Description |
|---|---|---|---|
| index | number | 0 | Chart axis index. If don't set - creates a new instance and adds it to the end of array. |
Returns:
anychart.core.axes.Linear - Axis instance by index.Try it:
- null/boolean - disable or enable chart X-axis.
- object - sets chart X-axis settings.
Params:
| Name | Type | Description |
|---|---|---|
| value | Object | boolean | null | Chart axis settings to set. |
Returns:
anychart.charts.Waterfall - Self instance for method chaining.- null/boolean - disable or enable chart X-axis by index.
- object - sets chart X-axis settings by index.
Params:
| Name | Type | Default | Description |
|---|---|---|---|
| index | number | 0 | Chart axis index. |
| value | Object | boolean | null | Chart axis settings to set. |
Returns:
anychart.charts.Waterfall - Self instance for method chaining.xScale
Params:
| Name | Type | Description |
|---|---|---|
| value | anychart.enums.ScaleTypes | anychart.scales.Base | X-scale to set. |
Returns:
anychart.charts.Waterfall - Self instance for method chaining.Try it:
xScroller
- null/boolean - disable or enable chart scroller.
- object - sets chart scroller settings.
Params:
| Name | Type | Description |
|---|---|---|
| value | Object | boolean | null | Chart scroller settings. |
Returns:
anychart.charts.Waterfall - Self instance for method chaining.xZoom
Params:
| Name | Type | Description |
|---|---|---|
| value | number | boolean | null | Object | Value to set. If you will pass null, true, false or number less than 1, then value will be converted in 1. |
Returns:
anychart.charts.Waterfall - Self instance for method chaining.Try it:
yAxis
Params:
| Name | Type | Default | Description |
|---|---|---|---|
| index | number | 0 | Chart axis index. If don't set - creates a new instance and adds it to the end of array. |
Returns:
anychart.core.axes.Linear - Axis instance by index.Try it:
Sets chart Y-axis settings depending on parameter type:
- null/boolean - disable or enable chart Y-axis.
- object - sets chart Y-axis settings.
Params:
| Name | Type | Description |
|---|---|---|
| value | Object | boolean | null | Chart axis settings to set. |
Returns:
anychart.charts.Waterfall - Self instance for method chaining.- null/boolean - disable or enable chart Y-axis by index.
- object - sets chart Y-axis settings by index.
Params:
| Name | Type | Default | Description |
|---|---|---|---|
| index | number | 0 | Chart axis index. |
| value | Object | boolean | null | Chart axis settings to set. |
Returns:
anychart.charts.Waterfall - Self instance for method chaining.yScale
Params:
| Name | Type | Description |
|---|---|---|
| value | anychart.enums.ScaleTypes | anychart.scales.Base | Y-scale to set. |
Returns:
anychart.charts.Waterfall - Self instance for method chaining.Try it:
zIndex
Returns:
number - The current zIndex.Try it:
Params:
| Name | Type | Default | Description |
|---|---|---|---|
| value | number | 0 | Value to set. |
Returns:
anychart.charts.Waterfall - Self instance for method chaining.Try it: