
class anychart.charts.Cartesian Improve this Doc
Extends: anychart.core.SeparateChart
Cartesian chart class.
To get the chart use any of these methods:
Methods Overview
| Specific settings | |
| annotations() | Creates annotations. |
| getType() | Definition of the chart type. |
| globalToLocal() | Converts the global coordinates to local coordinates. |
| localToGlobal() | Converts the local coordinates to global coordinates. |
| Axes and Scales | |
| getXAxesCount() | Returns the number of X-axes. |
| getXScales() | Returns chart X scales. |
| getYAxesCount() | Returns the number of Y-axes. |
| getYScales() | Returns chart Y scales. |
| grid() | Grid settings. |
| lineMarker() | Line marker settings. |
| minorGrid() | Minor grid settings. |
| rangeMarker() | Range marker settings. |
| textMarker() | Text marker settings. |
| xAxis() | X-axis settings. |
| xScale() | X-scale settings. |
| yAxis() | Y-axis settings. |
| yScale() | Y-scale settings. |
| Chart Coloring | |
| animation() | Animation settings |
| background() | Background settings. |
| hatchFillPalette() | Hatch fill palette settings. |
| markerPalette() | Markers palette settings. |
| palette() | Palette settings. |
| Chart Controls | |
| contextMenu() | Context menu settings. |
| credits() | Credits settings |
| label() | Label settings. |
| legend() | Legend settings. |
| title() | Title settings. |
| xScroller() | Scroller settings. |
| Coloring | |
| selectMarqueeFill() | Select marquee fill settings. |
| selectMarqueeStroke() | Stroke settings. |
| Data | |
| getSelectedPoints() | Getter for the selected points. |
| getStat() | Getter for a statistical value by the key. |
| Events | |
| listen() | Adds an event listener. |
| listenOnce() | Adds a single time event listener. |
| removeAllListeners() | Removes all listeners. |
| unlisten() | Removes the listener. |
| unlistenByKey() | Removes the listener by the key. |
| Export | |
| print() | Prints chart. |
| saveAsCsv() | Saves chart data as CSV file. |
| saveAsJpg() | Saves the current chart as JPEG image. |
| saveAsJson() | Saves chart config as JSON document. |
| saveAsPng() | Saves the current chart as PNG image. |
| saveAsSvg() | Saves the current chart as SVG image. |
| saveAsXlsx() | Saves chart data as Excel document. |
| saveAsXml() | Saves chart config as XML document. |
| toCsv() | Returns CSV string with series data. |
| toSvg() | Returns SVG string. |
| Interactivity | |
| crosshair() | Crosshair settings. |
| interactivity() | Interactivity settings. |
| startSelectMarquee() | Starts select marquee drawing. |
| tooltip() | Tooltip settings. |
| xZoom() | Zoom settings. |
| Point Elements | |
| hoverLabels() | Labels settings. |
| labels() | Labels settings. |
| selectLabels() | Labels settings. |
| Series | |
| area() | Adds Area series. |
| bar() | Adds Bar series. |
| box() | Adds Box series. |
| bubble() | Adds Bubble series. |
| candlestick() | Adds Candlestick series. |
| column() | Adds Column series. |
| hilo() | Adds HiLo series. |
| jumpLine() | Adds Jump Line series. |
| line() | Adds Line series. |
| marker() | Adds Marker series. |
| ohlc() | Adds OHLC series. |
| rangeArea() | Adds Range Area series. |
| rangeBar() | Adds Range Bar series. |
| rangeColumn() | Adds Range Column series. |
| rangeSplineArea() | Adds Range Spline Area series. |
| rangeStepArea() | Adds Range Step Area series. |
| spline() | Adds Spline series. |
| splineArea() | Adds Spline Area series. |
| stepArea() | Adds Step Area series. |
| stepLine() | Adds Step Line series. |
| stick() | Adds Stick series. |
| Size and Position | |
| bottom() | Bottom bound setting. |
| bounds() | Bounds settings. |
| getPixelBounds() | Returns pixel bounds of the chart. |
| getPlotBounds() | Returns data bounds of the chart. |
| height() | Height setting. |
| left() | Left bound setting. |
| margin() | Margin settings. |
| maxHeight() | Maximum height setting. |
| maxWidth() | Maximum width setting. |
| minHeight() | Minimum height setting. |
| minWidth() | Minimum width setting. |
| padding() | Padding settings. |
| right() | Right bound setting. |
| top() | Top bound setting. |
| width() | Width setting. |
| zIndex() | Z-index of the chart. |
| Specific Series Settings | |
| addSeries() | Adds series to the chart. |
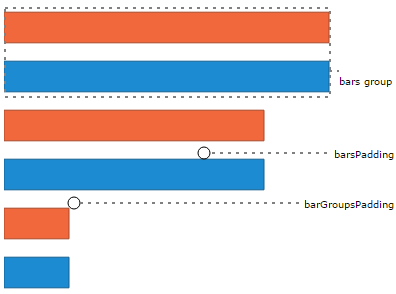
| barGroupsPadding() | Settings for the space between bar groups. |
| barsPadding() | Settings for the space between bars. |
| defaultSeriesType() | Default series type. |
| getSeries() | Returns series by id. |
| getSeriesAt() | Returns series by index. |
| getSeriesCount() | Returns the number of series in a chart. |
| maxBubbleSize() | Maximum size for all bubbles on the charts. |
| minBubbleSize() | Minimum size for all bubbles on the charts. |
| removeAllSeries() | Removes all series from chart. |
| removeSeries() | Removes one of series from chart by its id. |
| removeSeriesAt() | Removes one of series from chart by its index. |
| XML/JSON | |
| toJson() | Returns chart configuration as JSON object or string. |
| toXml() | Returns chart configuration as XML string or XMLNode. |
| Miscellaneous | |
| cancelMarquee() | Stops current marquee action if any. |
| container() | Chart container |
| data() | Getter for the data. |
| draw() | Drawing of cartesian chart. |
| inMarquee() | Gets marquee process running value. |
| saveAsPdf() | Saves the current chart as PDF image. |
Methods Description
addSeries
Params:
| Name | Type | Description |
|---|---|---|
| var_args | anychart.data.View | anychart.data.Set | Array | Chart series data. |
Returns:
Array.<anychart.core.cartesian.series.Base> - Array of created series.Try it:
animation
Returns:
anychart.core.utils.Animation - Returns true if the animation is enabled.Try it:
- null/boolean - disable or enable animation.
- object - sets animation settings.
Params:
| Name | Type | Default | Description |
|---|---|---|---|
| value | boolean | Object | false | Whether to enable animation. |
Returns:
anychart.charts.Cartesian - Self instance for method chaining.Params:
| Name | Type | Default | Description |
|---|---|---|---|
| enabled | boolean | false | Whether to enable animation. |
| duration | number | 1000 | Duration in milliseconds. |
Returns:
anychart.charts.Cartesian - Self instance for method chaining.Try it:
annotations
Returns:
anychart.core.annotations.PlotController - The plot annotations.Try it:
Params:
| Name | Type | Description |
|---|---|---|
| annotationsList | Array | Annotations list to set. |
Returns:
anychart.charts.Cartesian - Self instance for method chainingTry it:
area
Params:
| Name | Type | Description |
|---|---|---|
| data | anychart.data.View | anychart.data.Set | Array | Data for the series. |
| csvSettings | anychart.enums.TextParsingMode | anychart.data.TextParsingSettings | If CSV string is passed, you can pass CSV parser settings here as a hash map. |
Returns:
anychart.core.cartesian.series.Area - An instance of the created series.Try it:
background
Returns:
anychart.core.ui.Background - The current chart background.Try it:
- null/boolean - disable or enable chart background.
- object - sets chart background settings.
- string - sets chart background color.
Params:
| Name | Type | Description |
|---|---|---|
| value | string | Object | null | boolean | Background settings to set. |
Returns:
anychart.charts.Cartesian - Self instance for method chaining.bar
Params:
| Name | Type | Description |
|---|---|---|
| data | anychart.data.View | anychart.data.Set | Array | string | Data for the series. |
| csvSettings | anychart.enums.TextParsingMode | anychart.data.TextParsingSettings | If CSV string is passed, you can pass CSV parser settings here as a hash map. |
Returns:
anychart.core.cartesian.series.Bar - An instance of the created series.Try it:
barGroupsPadding
Returns:
number - Current bar groups padding.Try it:
See illustration at anychart.charts.Cartesian#barsPadding.
Params:
| Name | Type | Default | Description |
|---|---|---|---|
| value | number | 0.8 | Value to set. |
Returns:
anychart.charts.Cartesian - Self instance for method chaining.Try it:
barsPadding
Returns:
number - Current bars padding.Try it:
Params:
| Name | Type | Default | Description |
|---|---|---|---|
| value | number | 0.4 | Value to set. |
Returns:
anychart.charts.Cartesian - Self instance for method chaining.Try it:
bottom
Returns:
number | string | undefined - Current chart's bottom bound setting.var chart = anychart.cartesian(); chart.line([10, 4, 17, 20, 16, 35, 6, 15]); chart.bottom();
Params:
| Name | Type | Default | Description |
|---|---|---|---|
| value | number | string | null | null | Bottom bound setting for the chart. |
Returns:
anychart.charts.Cartesian - Returns self for method chaining.Try it:
bounds
Returns:
anychart.core.utils.Bounds - Current bounds of the element.var chart = anychart.cartesian(); chart.line([10, 4, 17, 20, 16, 35, 6, 15]); chart.bounds();
Params:
| Name | Type | Description |
|---|---|---|
| value | anychart.utils.RectObj | anychart.math.Rect | anychart.core.utils.Bounds | Bounds of teh chart. |
Returns:
anychart.charts.Cartesian - Self instance for method chaining.Try it:
Params:
| Name | Type | Default | Description |
|---|---|---|---|
| x | number | string | null | X-coordinate. |
| y | number | string | null | Y-coordinate. |
| width | number | string | null | Width. |
| height | number | string | null | Height. |
Returns:
anychart.charts.Cartesian - Self instance for method chaining.Try it:
box
Params:
| Name | Type | Description |
|---|---|---|
| data | anychart.data.View | anychart.data.Set | Array | string | Data for the series. |
| csvSettings | anychart.enums.TextParsingMode | anychart.data.TextParsingSettings | If CSV string is passed, you can pass CSV parser settings here as a hash map. |
Returns:
anychart.core.cartesian.series.Box - An instance of the created series.Try it:
bubble
Params:
| Name | Type | Description |
|---|---|---|
| data | anychart.data.View | anychart.data.Set | Array | string | Data for the series. |
| csvSettings | anychart.enums.TextParsingMode | anychart.data.TextParsingSettings | If CSV string is passed, you can pass CSV parser settings here as a hash map. |
Returns:
anychart.core.cartesian.series.Bubble - An instance of the created series.Try it:
cancelMarquee
Returns:
anychart.charts.Cartesian - Self instance for method chaining.candlestick
Params:
| Name | Type | Description |
|---|---|---|
| data | anychart.data.View | anychart.data.Set | Array | string | Data for the series. |
| csvSettings | anychart.enums.TextParsingMode | anychart.data.TextParsingSettings | If CSV string is passed, you can pass CSV parser settings here as a hash map. |
Returns:
anychart.core.cartesian.series.Candlestick - An instance of the created series.Try it:
column
Params:
| Name | Type | Description |
|---|---|---|
| data | anychart.data.View | anychart.data.Set | Array | string | Data for the series. |
| csvSettings | anychart.enums.TextParsingMode | anychart.data.TextParsingSettings | If CSV string is passed, you can pass CSV parser settings here as a hash map. |
Returns:
anychart.core.cartesian.series.Column - An instance of the created series.Try it:
container
Params:
| Name | Type | Description |
|---|---|---|
| value | anychart.graphics.vector.Layer | anychart.graphics.vector.Stage | string | Element | The value to set. |
Returns:
anychart.charts.Cartesian - Self instance for method chaining.Try it:
contextMenu
Returns:
anychart.ui.ContextMenu - The current context menu.Try it:
- null/boolean - disable or enable context menu.
- object - sets context menu settings.
Params:
| Name | Type | Description |
|---|---|---|
| value | Object | boolean | null | Context menu settings |
Returns:
anychart.charts.Cartesian - Self instance for method chaining.credits
Sets chart credits settings depending on parameter type:
- null/boolean - disable or enable chart credits.
- object - sets chart credits settings.
Params:
| Name | Type | Default | Description |
|---|---|---|---|
| value | Object | boolean | null | true | Credits settings |
Returns:
anychart.charts.Cartesian - Self instance for method chaining.crosshair
Returns:
anychart.core.ui.Crosshair - The current crosshair settings.Try it:
- null/boolean - disable or enable chart crosshair.
- object - sets chart crosshair settings.
Params:
| Name | Type | Default | Description |
|---|---|---|---|
| value | Object | boolean | null | false | Crosshair settings. |
Returns:
anychart.charts.Cartesian - Self instance for method chaining.data
Params:
| Name | Type | Description |
|---|---|---|
| value | anychart.data.Set | anychart.data.DataSettings | Array | Value to set |
Returns:
anychart.charts.Cartesian - Self instance for method chaining.defaultSeriesType
Returns:
string | anychart.enums.CartesianSeriesType - Default series type.Try it:
Params:
| Name | Type | Description |
|---|---|---|
| value | string | anychart.enums.CartesianSeriesType | Default series type. |
Returns:
anychart.charts.Cartesian - Self instance for method chaining.Try it:
draw
Params:
| Name | Type | Description |
|---|---|---|
| async | boolean | Whether do draw asynchronously. If set to true, the chart will be drawn asynchronously. |
Returns:
anychart.charts.Cartesian - Self instance for method chaining.Try it:
getPixelBounds
Returns pixel bounds of the chart due to parent bounds and self bounds settings.
Returns:
anychart.math.Rect - Pixel bounds of the chart.Try it:
getPlotBounds
Note: Works only after anychart.charts.Cartesian#draw is called.
Returns:
anychart.math.Rect - The current data bounds of the chart.Try it:
getSelectedPoints
Returns:
Array.<anychart.core.Point> - An array of the selected points.Try it:
getSeries
Params:
| Name | Type | Default | Description |
|---|---|---|---|
| id | number | string | index | Id of the series. |
Returns:
anychart.core.cartesian.series.Base - An instance of the created series.Try it:
getSeriesAt
Params:
| Name | Type | Description |
|---|---|---|
| index | number | Index of the series. |
Returns:
anychart.core.cartesian.series.Base - An instance of the created series.Try it:
getSeriesCount
getStat
Params:
| Name | Type | Description |
|---|---|---|
| key | string | anychart.enums.Statistics | Key. |
Returns:
* - Statistics value.Try it:
getType
getXAxesCount
Returns:
number - Number of X-axes.getXScales
Returns:
Array - An array of all X scales (including axes, grids, and axis markers scales).getYAxesCount
Returns:
number - Number of Y-axes.getYScales
Returns:
Array - An array of all Y scales (including axes, grids, and axis markers scales).Try it:
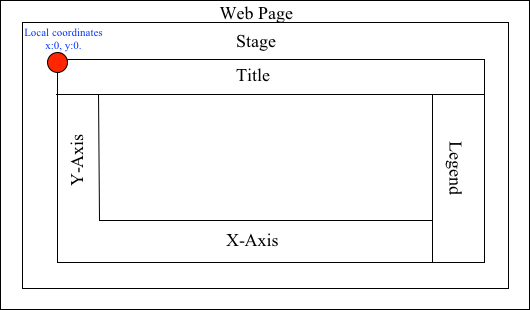
globalToLocal
On image below, the red point is a starting coordinate point of the chart bounds. Local coordinates work only in area of the stage (container).
Params:
| Name | Type | Description |
|---|---|---|
| xCoord | number | Global X coordinate. |
| yCoord | number | Global Y coordinate. |
Returns:
Object.<string, number> - Object with XY coordinates.Try it:
grid
Params:
| Name | Type | Default | Description |
|---|---|---|---|
| index | number | 0 | Chart grid index. If don't set - creates a new instance and adds it to the end of array. |
Returns:
anychart.core.grids.Linear - Grid instance by index.Try it:
- null/boolean - disable or enable chart grid.
- object - sets chart grid settings.
Params:
| Name | Type | Default | Description |
|---|---|---|---|
| value | Object | boolean | null | false | Chart grid settings to set. |
Returns:
anychart.charts.Cartesian - Self instance for method chaining.- null/boolean - disable or enable chart grid by index.
- object - sets chart grid settings by index.
Params:
| Name | Type | Default | Description |
|---|---|---|---|
| index | number | 0 | Chart grid index. |
| value | Object | boolean | null | false | Chart grid settings to set. |
Returns:
anychart.charts.Cartesian - Self instance for method chaining.hatchFillPalette
Returns:
anychart.palettes.HatchFills - Current chart hatch fill palette.Try it:
Params:
| Name | Type | Description |
|---|---|---|
| value | Array.<anychart.graphics.vector.HatchFill.HatchFillType> | Object | anychart.palettes.HatchFills | Chart hatch fill palette settings to set. |
Returns:
anychart.charts.Cartesian - Self instance for method chaining.Try it:
height
Returns:
number | string | undefined - Current chart's height setting.var chart = anychart.cartesian(); chart.line([10, 4, 17, 20, 16, 35, 6, 15]); chart.height();
Params:
| Name | Type | Default | Description |
|---|---|---|---|
| value | number | string | null | null | Height setting for the chart. |
Returns:
anychart.charts.Cartesian - Returns self for method chaining.Try it:
hilo
Params:
| Name | Type | Description |
|---|---|---|
| data | anychart.data.View | anychart.data.Set | Array | string | Data for the series. |
| csvSettings | anychart.enums.TextParsingMode | anychart.data.TextParsingSettings | If CSV string is passed, you can pass CSV parser settings here as a hash map. |
Returns:
anychart.core.cartesian.series.Hilo - An instance of the created series.Try it:
hoverLabels
Returns:
anychart.core.ui.LabelsFactory - Labels instance.Try it:
- null/boolean - disable or enable chart hover labels.
- object - sets chart hover labels settings.
Params:
| Name | Type | Description |
|---|---|---|
| value | Object | boolean | null | Series data labels settings. |
Returns:
anychart.charts.Cartesian - Self instance for method chaining.inMarquee
Returns:
boolean - Returns true if there is a marquee process running.interactivity
Returns:
anychart.core.utils.Interactivity - The current interactivity settings.Try it:
Params:
| Name | Type | Description |
|---|---|---|
| value | Object | anychart.enums.HoverMode | Settings object or boolean value like enabled state. |
Returns:
anychart.charts.Cartesian - Self instance for method chaining.Try it:
jumpLine
Params:
| Name | Type | Description |
|---|---|---|
| data | anychart.data.View | anychart.data.Set | Array | string | Data for the series. |
| csvSettings | anychart.enums.TextParsingMode | anychart.data.TextParsingSettings | If CSV string is passed, you can pass CSV parser settings here as a hash map. |
Returns:
anychart.core.cartesian.series.JumpLine - An instance of the created series.Try it:
label
Params:
| Name | Type | Default | Description |
|---|---|---|---|
| index | string | number | 0 | Index of instance. |
Returns:
anychart.core.ui.Label - An instance of class.Try it:
- null/boolean - disable or enable chart label.
- string - sets chart label text value.
- object - sets chart label settings.
Params:
| Name | Type | Default | Description |
|---|---|---|---|
| value | null | boolean | Object | string | false | Chart label instance to add by index 0. |
Returns:
anychart.charts.Cartesian - Self instance for method chaining.- null/boolean - disable or enable chart label.
- string - sets chart label text value.
- object - sets chart label settings.
Params:
| Name | Type | Default | Description |
|---|---|---|---|
| index | string | number | 0 | Label index. |
| value | null | boolean | Object | string | false | Chart label settings. |
Returns:
anychart.charts.Cartesian - Self instance for method chaining.labels
- null/boolean - disable or enable chart labels.
- object - sets chart labels settings.
Params:
| Name | Type | Description |
|---|---|---|
| value | Object | boolean | null | Series data labels settings. |
Returns:
anychart.charts.Cartesian - Self instance for method chaining.left
Returns:
number | string | undefined - Current chart's left bound setting.var chart = anychart.cartesian(); chart.line([10, 4, 17, 20, 16, 35, 6, 15]); chart.left();
Params:
| Name | Type | Default | Description |
|---|---|---|---|
| value | number | string | null | null | Left bound setting for the chart. |
Returns:
anychart.charts.Cartesian - Returns self for method chaining.Try it:
legend
Returns:
anychart.core.ui.Legend - An instance of the class for method chaining.Try it:
- null/boolean - disable or enable chart legend.
- object - sets chart legend settings.
Params:
| Name | Type | Default | Description |
|---|---|---|---|
| value | Object | boolean | null | false | Legend settings. |
Returns:
anychart.charts.Cartesian - An instance of the class for method chaining.line
Params:
| Name | Type | Description |
|---|---|---|
| data | anychart.data.View | anychart.data.Set | Array | string | Data for the series. |
| csvSettings | anychart.enums.TextParsingMode | anychart.data.TextParsingSettings | If CSV string is passed, you can pass CSV parser settings here as a hash map. |
Returns:
anychart.core.cartesian.series.Line - An instance of the created series.Try it:
lineMarker
Params:
| Name | Type | Default | Description |
|---|---|---|---|
| index | number | 0 | Chart line marker index. If don't set - creates a new instance and adds it to the end of array. |
Returns:
anychart.core.axisMarkers.Line - Line marker instance by index.Try it:
- null/boolean - disable or enable chart line marker.
- object - sets chart line marker settings.
Params:
| Name | Type | Default | Description |
|---|---|---|---|
| value | Object | boolean | null | false | Chart line marker settings to set. |
Returns:
anychart.charts.Cartesian - Self instance for method chaining.- null/boolean - disable or enable chart line marker by index.
- object - sets chart line marker settings by index.
Params:
| Name | Type | Default | Description |
|---|---|---|---|
| index | number | 0 | Chart line marker index. |
| value | Object | boolean | null | Chart line marker settings to set. |
Returns:
anychart.charts.Cartesian - Self instance for method chaining.listen
Note: Notice that if the existing listener is one-off (added using listenOnce), it will cease to be such after calling the listen() method.
Params:
| Name | Type | Default | Description |
|---|---|---|---|
| type | string | The event type id. | |
| listener | function | Callback method. | |
| useCapture | boolean | false | Whether to fire in capture phase. Learn more about capturing https://javascript.info/bubbling-and-capturing |
| listenerScope | Object | Object in whose scope to call the listener. |
Returns:
Object - Unique key for the listener.Try it:
listenOnce
If the event handler being added already exists, listenOnce will do nothing.
Note: In particular, if the handler is already registered using listen(), listenOnce() will not make it one-off. Similarly, if a one-off listener already exists, listenOnce will not change it (it wil remain one-off).
Params:
| Name | Type | Default | Description |
|---|---|---|---|
| type | string | The event type id. | |
| listener | function | Callback method. | |
| useCapture | boolean | false | Whether to fire in capture phase. Learn more about capturing https://javascript.info/bubbling-and-capturing |
| listenerScope | Object | Object in whose scope to call the listener. |
Returns:
Object - Unique key for the listener.Try it:
localToGlobal
On image below, the red point is a starting coordinate point of the chart bounds. Local coordinates work only in area of the stage (container).
Params:
| Name | Type | Description |
|---|---|---|
| xCoord | number | Local X coordinate. |
| yCoord | number | Local Y coordinate. |
Returns:
Object.<string, number> - Object with XY coordinates.Try it:
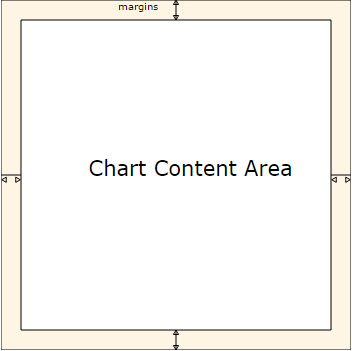
margin
Returns:
anychart.core.utils.Margin - Chart margin.Try it:
Params:
| Name | Type | Default | Description |
|---|---|---|---|
| value | Array.<(number|string)> | Object | {top: 0, right: 0, bottom: 0, left: 0} | Value to set. |
Returns:
anychart.charts.Cartesian - Self instance for method chaining.// all margins 15px
chart.margin(15);
// all margins 15px
chart.margin("15px");
// top and bottom 5px, right and left 15px
chart.margin(anychart.utils.margin(5, 15));Try it:
Params:
| Name | Type | Default | Description |
|---|---|---|---|
| value1 | string | number | 0 | Top or top-bottom space. |
| value2 | string | number | 0 | Right or right-left space. |
| value3 | string | number | 0 | Bottom space. |
| value4 | string | number | 0 | Left space. |
Returns:
anychart.charts.Cartesian - Self instance for method chaining.// 1) all 10px chart.margin(10); // 2) top and bottom 10px, left and right 15px chart.margin(10, "15px"); // 3) top 10px, left and right 15px, bottom 5px chart.margin(10, "15px", 5); // 4) top 10px, right 15px, bottom 5px, left 12px chart.margin(10, "15px", "5px", 12);
Try it:
marker
Params:
| Name | Type | Description |
|---|---|---|
| data | anychart.data.View | anychart.data.Set | Array | string | Data for the series. |
| csvSettings | anychart.enums.TextParsingMode | anychart.data.TextParsingSettings | If CSV string is passed, you can pass CSV parser settings here as a hash map. |
Returns:
anychart.core.cartesian.series.Marker - An instance of the created series.Try it:
markerPalette
Returns:
anychart.palettes.Markers - Current chart markers palette.Try it:
Params:
| Name | Type | Description |
|---|---|---|
| value | anychart.palettes.Markers | Object | Array.<anychart.enums.MarkerType> | Chart marker palette settings to set. |
Returns:
anychart.charts.Cartesian - Self instance for method chaining.Try it:
maxBubbleSize
Returns:
number | string - The current maximum size all of the bubbles.Try it:
Params:
| Name | Type | Default | Description |
|---|---|---|---|
| value | number | string | "20%" | Maximum size to set. |
Returns:
anychart.charts.Cartesian - Self instance for method chaining.Try it:
maxHeight
Returns:
number | string | null - Current chart's maximum height.var chart = anychart.cartesian(); chart.line([10, 4, 17, 20, 16, 35, 6, 15]); chart.maxHeight();
Params:
| Name | Type | Default | Description |
|---|---|---|---|
| value | number | string | null | null | Value to set. |
Returns:
anychart.charts.Cartesian - Self instance for method chaining.Try it:
maxWidth
Returns:
number | string | null - Current chart's maximum width.var chart = anychart.cartesian(); chart.line([10, 4, 17, 20, 16, 35, 6, 15]); chart.maxWidth();
Params:
| Name | Type | Default | Description |
|---|---|---|---|
| value | number | string | null | null | Value to set. |
Returns:
anychart.charts.Cartesian - Self instance for method chaining.Try it:
minBubbleSize
Returns:
number | string - The current minimum size of the all bubbles.Try it:
Params:
| Name | Type | Default | Description |
|---|---|---|---|
| value | number | string | "5%" | Minimum size to set. |
Returns:
anychart.charts.Cartesian - Self instance for method chaining.Try it:
minHeight
Returns:
number | string | null - Current chart's minimum height.var chart = anychart.cartesian(); chart.line([10, 4, 17, 20, 16, 35, 6, 15]); chart.minHeight();
Params:
| Name | Type | Default | Description |
|---|---|---|---|
| value | number | string | null | null | Value to set. |
Returns:
anychart.charts.Cartesian - Self instance for method chaining.Try it:
minWidth
Returns:
number | string | null - Current chart's minimum width.var chart = anychart.cartesian(); chart.line([10, 4, 17, 20, 16, 35, 6, 15]); chart.minWidth();
Params:
| Name | Type | Default | Description |
|---|---|---|---|
| value | number | string | null | null | Value to set. |
Returns:
anychart.charts.Cartesian - Self instance for method chaining.Try it:
minorGrid
Params:
| Name | Type | Default | Description |
|---|---|---|---|
| index | number | 0 | Chart minor grid index. If don't set - creates a new instance and adds it to the end of array. |
Returns:
anychart.core.grids.Linear - Minor grid instance by index.Try it:
- null/boolean - disable or enable chart minor grid.
- object - sets chart minor grid settings.
Params:
| Name | Type | Default | Description |
|---|---|---|---|
| value | Object | boolean | null | false | Chart minor grid settings to set. |
Returns:
anychart.charts.Cartesian - Self instance for method chaining.- null/boolean - disable or enable chart minor grid by index.
- object - sets chart minor grid settings by index.
Params:
| Name | Type | Default | Description |
|---|---|---|---|
| index | number | 0 | Chart minor grid index. |
| value | Object | boolean | null | false | Chart minor grid settings to set. |
Returns:
anychart.charts.Cartesian - Self instance for method chaining.ohlc
Params:
| Name | Type | Description |
|---|---|---|
| data | anychart.data.View | anychart.data.Set | Array | string | Data for the series. |
| csvSettings | anychart.enums.TextParsingMode | anychart.data.TextParsingSettings | If CSV string is passed, you can pass CSV parser settings here as a hash map. |
Returns:
anychart.core.cartesian.series.OHLC - An instance of the created series.Try it:
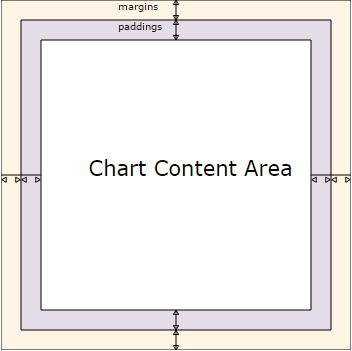
padding
Returns:
anychart.core.utils.Padding - Chart padding.Try it:
Params:
| Name | Type | Default | Description |
|---|---|---|---|
| value | Array.<(number|string)> | Object | {top: 0, right: 0, bottom: 0, left: 0} | Value to set. |
Returns:
anychart.charts.Cartesian - Self instance for method chaining.chart.padding([5, 15]);
or
chart.padding({left: 10, top: 20, bottom: 30, right: "40%"}});Try it:
Params:
| Name | Type | Default | Description |
|---|---|---|---|
| value1 | string | number | 0 | Top or top-bottom space. |
| value2 | string | number | 0 | Right or right-left space. |
| value3 | string | number | 0 | Bottom space. |
| value4 | string | number | 0 | Left space. |
Returns:
anychart.charts.Cartesian - Self instance for method chaining.// 1) all 10px chart.padding(10); // 2) top and bottom 10px, left and right 15px chart.padding(10, "15px"); // 3) top 10px, left and right 15px, bottom 5px chart.padding(10, "15px", 5); // 4) top 10px, right 15%, bottom 5px, left 12px chart.padding(10, "15%", "5px", 12);
Try it:
palette
Try it:
Params:
| Name | Type | Description |
|---|---|---|
| value | anychart.palettes.RangeColors | anychart.palettes.DistinctColors | Object | Array.<string> | Series colors palette settings to set. |
Returns:
anychart.charts.Cartesian - Self instance for method chaining.Params:
| Name | Type | Default | Description |
|---|---|---|---|
| paperSize | anychart.graphics.vector.PaperSize | Paper size. | |
| landscape | boolean | false | Flag of landscape. |
Try it:
rangeArea
Params:
| Name | Type | Description |
|---|---|---|
| data | anychart.data.View | anychart.data.Set | Array | string | Data for the series. |
| csvSettings | anychart.enums.TextParsingMode | anychart.data.TextParsingSettings | If CSV string is passed, you can pass CSV parser settings here as a hash map. |
Returns:
anychart.core.cartesian.series.RangeArea - An instance of the created series.Try it:
rangeBar
Params:
| Name | Type | Description |
|---|---|---|
| data | anychart.data.View | anychart.data.Set | Array | string | Data for the series. |
| csvSettings | anychart.enums.TextParsingMode | anychart.data.TextParsingSettings | If CSV string is passed, you can pass CSV parser settings here as a hash map. |
Returns:
anychart.core.cartesian.series.RangeBar - An instance of the created series.Try it:
rangeColumn
Params:
| Name | Type | Description |
|---|---|---|
| data | anychart.data.View | anychart.data.Set | Array | string | Data for the series. |
| csvSettings | anychart.enums.TextParsingMode | anychart.data.TextParsingSettings | If CSV string is passed, you can pass CSV parser settings here as a hash map. |
Returns:
anychart.core.cartesian.series.RangeColumn - An instance of the created series.Try it:
rangeMarker
Params:
| Name | Type | Default | Description |
|---|---|---|---|
| index | number | 0 | Chart range marker index. If don't set - creates a new instance and adds it to the end of array. |
Returns:
anychart.core.axisMarkers.Range - Range marker instance by index.Try it:
- null/boolean - disable or enable chart range marker.
- object - sets chart range marker settings.
Params:
| Name | Type | Default | Description |
|---|---|---|---|
| value | Object | boolean | null | false | Chart range marker settings to set. |
Returns:
anychart.charts.Cartesian - Self instance for method chaining.- null/boolean - disable or enable chart range marker by index.
- object - sets chart range marker settings by index.
Params:
| Name | Type | Default | Description |
|---|---|---|---|
| index | number | 0 | Chart range marker index. |
| value | Object | boolean | null | Chart range marker settings to set. |
Returns:
anychart.charts.Cartesian - Self instance for method chaining.rangeSplineArea
Params:
| Name | Type | Description |
|---|---|---|
| data | anychart.data.View | anychart.data.Set | Array | string | Data for the series. |
| csvSettings | anychart.enums.TextParsingMode | anychart.data.TextParsingSettings | If CSV string is passed, you can pass CSV parser settings here as a hash map. |
Returns:
anychart.core.cartesian.series.RangeSplineArea - An instance of the created series.Try it:
rangeStepArea
Params:
| Name | Type | Description |
|---|---|---|
| data | anychart.data.View | anychart.data.Set | Array | string | Data for the series. |
| csvSettings | anychart.enums.TextParsingMode | anychart.data.TextParsingSettings | If CSV string is passed, you can pass CSV parser settings here as a hash map. |
Returns:
anychart.core.cartesian.series.RangeStepArea - An instance of the created series.Try it:
removeAllListeners
Params:
| Name | Type | Description |
|---|---|---|
| type | string | Type of event to remove, default is to remove all types. |
Returns:
number - Number of listeners removed.Try it:
removeAllSeries
Returns:
anychart.charts.Cartesian - Self instance for method chaining.Try it:
removeSeries
Params:
| Name | Type | Description |
|---|---|---|
| id | number | string | Series id. |
Returns:
anychart.charts.Cartesian - Self instance for method chaining.Try it:
removeSeriesAt
Params:
| Name | Type | Description |
|---|---|---|
| index | number | Series index. |
Returns:
anychart.charts.Cartesian - Self instance for method chaining.Try it:
right
Returns:
number | string | undefined - Current chart's right bound setting.var chart = anychart.cartesian(); chart.line([10, 4, 17, 20, 16, 35, 6, 15]); chart.right();
Params:
| Name | Type | Default | Description |
|---|---|---|---|
| value | number | string | null | null | Right bound setting for the chart. |
Returns:
anychart.charts.Cartesian - Returns self for method chaining.Try it:
saveAsCsv
Params:
| Name | Type | Description |
|---|---|---|
| chartDataExportMode | string | anychart.enums.ChartDataExportMode | Data export mode. |
| csvSettings | Object.<string, (string|boolean|undefined)> | CSV settings. |
| filename | string | File name to save. |
Try it:
saveAsJpg
Params:
| Name | Type | Description |
|---|---|---|
| width | number | Image width. |
| height | number | Image height. |
| quality | number | Image quality in ratio 0-1. |
| forceTransparentWhite | boolean | Define, should we force transparent to white background. |
Try it:
saveAsJson
Params:
| Name | Type | Description |
|---|---|---|
| includeTheme | boolean | If the current theme properties should be included into the result. |
| filename | string | File name to save. |
Try it:
saveAsPdf
Params:
| Name | Type | Description |
|---|---|---|
| paperSize | string | Any paper format like 'a0', 'tabloid', 'b4', etc. |
| landscape | boolean | Define, is landscape. |
| x | number | Offset X. |
| y | number | Offset Y. |
Try it:
saveAsPng
Params:
| Name | Type | Description |
|---|---|---|
| width | number | Image width. |
| height | number | Image height. |
| quality | number | Image quality in ratio 0-1. |
Try it:
saveAsSvg
Params:
| Name | Type | Description |
|---|---|---|
| paperSize | string | Paper Size. |
| landscape | boolean | Landscape. |
Try it:
Params:
| Name | Type | Description |
|---|---|---|
| width | number | Image width. |
| height | number | Image height. |
Try it:
saveAsXlsx
Params:
| Name | Type | Description |
|---|---|---|
| chartDataExportMode | string | anychart.enums.ChartDataExportMode | Data export mode. |
| filename | string | File name to save. |
Try it:
saveAsXml
Params:
| Name | Type | Description |
|---|---|---|
| includeTheme | boolean | If the current theme properties should be included into the result. |
| filename | string | File name to save. |
Try it:
selectLabels
Returns:
anychart.core.ui.LabelsFactory - Labels instance.Try it:
- null/boolean - disable or enable chart select labels.
- object - sets chart hover labels settings.
Params:
| Name | Type | Description |
|---|---|---|
| value | Object | boolean | null | Series data labels settings. |
Returns:
anychart.core.ui.LabelsFactory - Labels instance.selectMarqueeFill
Returns:
anychart.graphics.vector.Fill - Select marquee fill.var selectMarqueeFill = chart.selectMarqueeFill();
Params:
| Name | Type | Description |
|---|---|---|
| value | anychart.graphics.vector.Fill | Color as an object or a string. |
Returns:
anychart.charts.Cartesian - Self instance for method chaining.Try it:
Params:
| Name | Type | Description |
|---|---|---|
| color | string | Color as a string. |
| opacity | number | Color opacity. |
Returns:
anychart.charts.Cartesian - Self instance for method chaining.Try it:
Params:
| Name | Type | Description |
|---|---|---|
| keys | Array.<(anychart.graphics.vector.GradientKey|string)> | Gradient keys. |
| angle | number | Gradient angle. |
| mode | boolean | anychart.graphics.vector.Rect | Object | Gradient mode. |
| opacity | number | Gradient opacity. |
Returns:
anychart.charts.Cartesian - Self instance for method chaining.Try it:
Params:
| Name | Type | Description |
|---|---|---|
| keys | Array.<(anychart.graphics.vector.GradientKey|string)> | Color-stop gradient keys. |
| cx | number | X ratio of center radial gradient. |
| cy | number | Y ratio of center radial gradient. |
| mode | anychart.graphics.math.Rect | If defined then userSpaceOnUse mode, else objectBoundingBox. |
| opacity | number | Opacity of the gradient. |
| fx | number | X ratio of focal point. |
| fy | number | Y ratio of focal point. |
Returns:
anychart.charts.Cartesian - Self instance for method chaining.Try it:
Params:
| Name | Type | Description |
|---|---|---|
| imageSettings | anychart.graphics.vector.Fill | Object with settings. |
Returns:
anychart.charts.Cartesian - Self instance for method chaining.Try it:
selectMarqueeStroke
Returns:
anychart.graphics.vector.Stroke - Select marquee stroke.var selectMarqueeStroke = chart.selectMarqueeStroke();
Params:
| Name | Type | Default | Description |
|---|---|---|---|
| color | anychart.graphics.vector.Stroke | anychart.graphics.vector.ColoredFill | string | null | Stroke settings. | |
| thickness | number | 1 | Line thickness. |
| dashpattern | string | Controls the pattern of dashes and gaps used to stroke paths. | |
| lineJoin | anychart.graphics.vector.StrokeLineJoin | Line join style. | |
| lineCap | anychart.graphics.vector.StrokeLineCap | Line cap style. |
Returns:
anychart.charts.Cartesian - Self instance for method chaining.Try it:
spline
Params:
| Name | Type | Description |
|---|---|---|
| data | anychart.data.View | anychart.data.Set | Array | string | Data for the series. |
| csvSettings | anychart.enums.TextParsingMode | anychart.data.TextParsingSettings | If CSV string is passed, you can pass CSV parser settings here as a hash map. |
Returns:
anychart.core.cartesian.series.Spline - An instance of the created series.Try it:
splineArea
Params:
| Name | Type | Description |
|---|---|---|
| data | anychart.data.View | anychart.data.Set | Array | string | Data for the series. |
| csvSettings | anychart.enums.TextParsingMode | anychart.data.TextParsingSettings | If CSV string is passed, you can pass CSV parser settings here as a hash map. |
Returns:
anychart.core.cartesian.series.SplineArea - An instance of the created series.Try it:
startSelectMarquee
Params:
| Name | Type | Description |
|---|---|---|
| repeat | boolean | Whether to start select marquee drawing. |
Returns:
anychart.charts.Cartesian - Self instance for method chaining.Try it:
stepArea
Params:
| Name | Type | Description |
|---|---|---|
| data | anychart.data.View | anychart.data.Set | Array | string | Data for the series. |
| csvSettings | anychart.enums.TextParsingMode | anychart.data.TextParsingSettings | If CSV string is passed, you can pass CSV parser settings here as a hash map. |
Returns:
anychart.core.cartesian.series.StepArea - An instance of the created series.Try it:
stepLine
Params:
| Name | Type | Description |
|---|---|---|
| data | anychart.data.View | anychart.data.Set | Array | string | Data for the series. |
| csvSettings | anychart.enums.TextParsingMode | anychart.data.TextParsingSettings | If CSV string is passed, you can pass CSV parser settings here as a hash map. |
Returns:
anychart.core.cartesian.series.StepLine - An instance of the created series.Try it:
stick
Params:
| Name | Type | Description |
|---|---|---|
| data | anychart.data.View | anychart.data.Set | Array | string | Data for the series. |
| csvSettings | anychart.enums.TextParsingMode | anychart.data.TextParsingSettings | If CSV string is passed, you can pass CSV parser settings here as a hash map. |
Returns:
anychart.core.cartesian.series.Stick - An instance of the created series.Try it:
textMarker
Params:
| Name | Type | Default | Description |
|---|---|---|---|
| index | number | 0 | Chart text marker index. If don't set - creates a new instance and adds it to the end of array. |
Returns:
anychart.core.axisMarkers.Text - Text marker instance by index.Try it:
- null/boolean - disable or enable chart text marker.
- object - sets chart text marker settings.
Params:
| Name | Type | Default | Description |
|---|---|---|---|
| value | Object | boolean | null | false | Chart text marker settings to set. |
Returns:
anychart.charts.Cartesian - Self instance for method chaining.- null/boolean - disable or enable chart text marker by index.
- object - sets chart text marker settings by index.
Params:
| Name | Type | Default | Description |
|---|---|---|---|
| index | number | 0 | Chart text marker index. |
| value | Object | boolean | null | Chart text marker settings to set. |
Returns:
anychart.charts.Cartesian - Self instance for method chaining.title
- null/boolean - disable or enable chart title.
- string - sets chart title text value.
- object - sets chart title settings.
Params:
| Name | Type | Default | Description |
|---|---|---|---|
| value | null | boolean | Object | string | false | Chart title text or title instance for copy settings from. |
Returns:
anychart.charts.Cartesian - Self instance for method chaining.toCsv
Params:
| Name | Type | Description |
|---|---|---|
| chartDataExportMode | string | anychart.enums.ChartDataExportMode | Data export mode. |
| csvSettings | Object.<string, (string|boolean|undefined)> | CSV settings. |
Returns:
string - CSV string.Try it:
toJson
Params:
| Name | Type | Default | Description |
|---|---|---|---|
| stringify | boolean | false | Returns JSON as string. |
| includeTheme | boolean | false | If the current theme properties should be included into the result. |
Returns:
Object | string - Chart configuration.toSvg
Params:
| Name | Type | Description |
|---|---|---|
| paperSize | string | Paper Size. |
| landscape | boolean | Landscape. |
Returns:
string - SVG content or empty string.Try it:
Params:
| Name | Type | Description |
|---|---|---|
| width | number | Image width. |
| height | number | Image height. |
Returns:
string - SVG content or empty string.Try it:
toXml
Params:
| Name | Type | Default | Description |
|---|---|---|---|
| asXmlNode | boolean | false | Return XML as XMLNode. |
| includeTheme | boolean | false | If the current theme properties should be included into the result. |
Returns:
string | Node - Chart configuration.tooltip
Returns:
anychart.core.ui.Tooltip - An instance of the class for method chaining.chart.tooltip();
- null/boolean - disable or enable tooltip.
- object - sets tooltip settings.
Params:
| Name | Type | Description |
|---|---|---|
| value | Object | boolean | null |
Returns:
anychart.charts.Cartesian - Self instance for method chaining.top
Returns:
number | string | undefined - Current chart's top bound setting.var chart = anychart.cartesian(); chart.line([10, 4, 17, 20, 16, 35, 6, 15]); chart.top();
Params:
| Name | Type | Default | Description |
|---|---|---|---|
| value | number | string | null | null | Top bound setting for the chart. |
Returns:
anychart.charts.Cartesian - Returns self for method chaining.Try it:
unlisten
Params:
| Name | Type | Default | Description |
|---|---|---|---|
| type | string | The event type id. | |
| listener | function | Callback method. | |
| useCapture | boolean | false | Whether to fire in capture phase. Learn more about capturing https://javascript.info/bubbling-and-capturing |
| listenerScope | Object | Object in whose scope to call the listener. |
Returns:
boolean - Whether any listener was removed.Try it:
unlistenByKey
Params:
| Name | Type | Description |
|---|---|---|
| key | Object | The key returned by listen() or listenOnce(). |
Returns:
boolean - Whether any listener was removed.Try it:
width
Returns:
number | string | undefined - Current chart's width setting.var chart = anychart.cartesian(); chart.line([10, 4, 17, 20, 16, 35, 6, 15]); chart.width();
Params:
| Name | Type | Default | Description |
|---|---|---|---|
| value | number | string | null | null | Width setting for the chart. |
Returns:
anychart.charts.Cartesian - Returns self for method chaining.Try it:
xAxis
Params:
| Name | Type | Default | Description |
|---|---|---|---|
| index | number | 0 | Chart axis index. If don't set - creates a new instance and adds it to the end of array. |
Returns:
anychart.core.axes.Linear - Axis instance by index.Try it:
- null/boolean - disable or enable chart X-axis.
- object - sets chart X-axis settings.
Params:
| Name | Type | Description |
|---|---|---|
| value | Object | boolean | null | Chart axis settings to set. |
Returns:
anychart.charts.Cartesian - Self instance for method chaining.- null/boolean - disable or enable chart X-axis by index.
- object - sets chart X-axis settings by index.
Params:
| Name | Type | Default | Description |
|---|---|---|---|
| index | number | 0 | Chart axis index. |
| value | Object | boolean | null | Chart axis settings to set. |
Returns:
anychart.charts.Cartesian - Self instance for method chaining.xScale
Returns:
anychart.scales.Ordinal - Default chart scale value.Try it:
Params:
| Name | Type | Description |
|---|---|---|
| value | anychart.enums.ScaleTypes | anychart.scales.Base | X-scale to set. |
Returns:
anychart.charts.Cartesian - Self instance for method chaining.Try it:
xScroller
Returns:
anychart.core.ui.ChartScroller - The current scroller settings.Try it:
- null/boolean - disable or enable chart scroller.
- object - sets chart scroller settings.
Params:
| Name | Type | Description |
|---|---|---|
| value | Object | boolean | null | Chart scroller settings. |
Returns:
anychart.charts.Cartesian - Self instance for method chaining.xZoom
Returns:
anychart.core.utils.OrdinalZoom - The current zoom settings.Try it:
Params:
| Name | Type | Description |
|---|---|---|
| value | number | boolean | null | Object | Value to set. If you will pass null, true, false or number less than 1, then value will be converted in 1. |
Returns:
anychart.charts.Cartesian - Self instance for method chaining.Try it:
yAxis
Params:
| Name | Type | Default | Description |
|---|---|---|---|
| index | number | 0 | Chart axis index. If don't set - creates a new instance and adds it to the end of array. |
Returns:
anychart.core.axes.Linear - Axis instance by index.Try it:
Sets chart Y-axis settings depending on parameter type:
- null/boolean - disable or enable chart Y-axis.
- object - sets chart Y-axis settings.
Params:
| Name | Type | Description |
|---|---|---|
| value | Object | boolean | null | Chart axis settings to set. |
Returns:
anychart.charts.Cartesian - Self instance for method chaining.- null/boolean - disable or enable chart Y-axis by index.
- object - sets chart Y-axis settings by index.
Params:
| Name | Type | Default | Description |
|---|---|---|---|
| index | number | 0 | Chart axis index. |
| value | Object | boolean | null | Chart axis settings to set. |
Returns:
anychart.charts.Cartesian - Self instance for method chaining.yScale
Returns:
anychart.scales.Linear - Default chart scale value.Try it:
Params:
| Name | Type | Description |
|---|---|---|
| value | anychart.enums.ScaleTypes | anychart.scales.Base | Y-scale to set. |
Returns:
anychart.charts.Cartesian - Self instance for method chaining.Try it:
zIndex
Returns:
number - The current Z-index.var chart = anychart.line([1, 2, 3, 4], [2, 3, 4, 1], [3, 4, 1, 2], [4, 1, 2, 3]); chart.zIndex();
Params:
| Name | Type | Default | Description |
|---|---|---|---|
| value | number | 0 | Value to set. |
Returns:
anychart.charts.Cartesian - Self instance for method chaining.Try it: