
class anychart.charts.Stock Improve this Doc
Extends: anychart.core.Chart
Stock chart class.
Note: Use anychart#stock method to get an instance of this class.
Methods Overview
| Specific settings | |
| a11y() | Accessibility settings. |
| annotations() | Gets annotations. |
| getPlotsCount() | Returns the number of plots. |
| getType() | Definition of the chart type. |
| globalToLocal() | Converts the global coordinates to local coordinates. |
| localToGlobal() | Converts the local coordinates to global coordinates. |
| plot() | Plots settings. |
| scroller() | Scroller settings. |
| toA11yTable() | Creates and returns the chart represented as an invisible HTML table. |
| toHtmlTable() | Creates and returns a chart as HTML table. |
| Axes and Scales | |
| xScale() | X-scale settings. |
| Chart Controls | |
| contextMenu() | Context menu settings. |
| credits() | Credits settings |
| label() | Label settings. |
| splitters() | Splitters settings. |
| title() | Title settings. |
| Coloring | |
| background() | Background settings. |
| zoomMarqueeFill() | Zoom marquee fill settings. |
| zoomMarqueeStroke() | Stroke settings. |
| Data | |
| getSelectedRange() | Gets selected range. |
| grouping() | Grouping settings. |
| scrollerGrouping() | Scroller grouping settings. |
| Events | |
| listen() | Adds an event listener. |
| listenOnce() | Adds a single time event listener |
| removeAllListeners() | Removes all listeners. |
| unlisten() | Removes the listener |
| unlistenByKey() | Removes the listener by the key. |
| Export | |
| exports() | Exports settings |
| getJpgBase64String() | Returns JPG as base64 string. |
| getPdfBase64String() | Returns PDF as base64 string. |
| getPngBase64String() | Returns PNG as base64 string. |
| getSvgBase64String() | Returns SVG as base64 string. |
| print() | Prints chart |
| saveAsCsv() | Saves chart data as a CSV file. |
| saveAsJpg() | Saves the chart as JPEG image. |
| saveAsJson() | Saves chart config as JSON document. |
| saveAsPdf() | Saves the chart as PDF image. |
| saveAsPng() | Saves the chart as PNG image. |
| saveAsSvg() | Saves the chart as SVG image. |
| saveAsXlsx() | Saves chart data as an Excel document. |
| saveAsXml() | Saves chart config as XML document. |
| shareAsJpg() | Shares a chart as a JPG file and returns a link to the shared image. |
| shareAsPdf() | Shares a chart as a PDF file and returns a link to the shared image. |
| shareAsPng() | Shares a chart as a PNG file and returns a link to the shared image. |
| shareAsSvg() | Shares a chart as a SVG file and returns a link to the shared image. |
| shareWithFacebook() | Opens Facebook sharing dialog. |
| shareWithLinkedIn() | Opens LinkedIn sharing dialog. |
| shareWithPinterest() | Opens Pinterest sharing dialog. |
| shareWithTwitter() | Opens Twitter sharing dialog. |
| toCsv() | Returns CSV string with the chart data. |
| toSvg() | Returns SVG string. |
| Interactivity | |
| crosshair() | Crosshair settings |
| interactivity() | Interactivity settings. |
| preserveSelectedRangeOnDataUpdate() | Selected Range Change Behaviour |
| startZoomMarquee() | Starts zoom marquee. |
| tooltip() | Tooltip settings. |
| Point Elements | |
| eventMarkers() | Event markers settings |
| Size and Position | |
| bottom() | Bottom bound settings. |
| bounds() | Bounds settings. |
| getPixelBounds() | Returns pixel bounds of the chart. |
| height() | Height setting. |
| left() | Left bound setting. |
| margin() | Margin settings. |
| maxHeight() | Maximum height setting. |
| maxWidth() | Maximum width setting. |
| minHeight() | Minimum height setting. |
| minWidth() | Minimum width setting. |
| padding() | Padding settings. |
| right() | Right bound setting. |
| top() | Top bound settings. |
| width() | Width setting. |
| zIndex() | Z-index of the chart. |
| Miscellaneous | |
| autoRedraw() | Redraw chart after changes or not. |
| cancelMarquee() | Stops marquee action if any. |
| container() | Chart container |
| draw() | Chart drawing |
| fullScreen() | Fullscreen mode. |
| id() | Chart id. |
| inMarquee() | Gets marquee process running value. |
| isFullScreenAvailable() | Whether the fullscreen mode available in the browser or not. |
| selectRange() | Setter for the select range using date. |
Methods Description
a11y
Returns:
anychart.core.utils.ChartA11y - Accessibility settings object.var stateOfAccsessibility = chart.a11y();
Sets accessibility setting depending on parameter type:
- boolean - disable or enable accessibility.
- object - sets accessibility settings.
Params:
| Name | Type | Description |
|---|---|---|
| settings | boolean | Object | Whether to enable accessibility or object with settings. |
Returns:
anychart.charts.Stock - Self instance for method chaining.annotations
Returns:
anychart.core.annotations.ChartController - The annotations controller.Try it:
autoRedraw
Flag whether to automatically call chart.draw() on any changes or not.
Returns:
boolean - AutoRedraw flag.var autoRedraw = chart.autoRedraw();
Flag whether to automatically call chart.draw() on any changes or not.
Params:
| Name | Type | Default | Description |
|---|---|---|---|
| enabled | boolean | true | Value to set. |
Returns:
anychart.charts.Stock - Self instance for method chaining.Try it:
background
- null/boolean - disable or enable chart background.
- object - sets chart background settings.
- string - sets chart background color.
Params:
| Name | Type | Description |
|---|---|---|
| settings | string | Object | null | boolean | Background settings to set. |
Returns:
anychart.charts.Stock - Self instance for method chaining.bottom
Returns:
number | string | undefined - Chart's bottom bound settings.var bottom = chart.bottom();
Params:
| Name | Type | Description |
|---|---|---|
| bottom | number | string | null | Bottom bound for the chart. |
Returns:
anychart.charts.Stock - Self instance for method chaining.Try it:
bounds
Returns:
anychart.core.utils.Bounds - Bounds of the element.var bounds = chart.bounds();
Params:
| Name | Type | Description |
|---|---|---|
| bounds | anychart.utils.RectObj | anychart.math.Rect | anychart.core.utils.Bounds | Bounds of teh chart. |
Returns:
anychart.charts.Stock - Self instance for method chaining.Try it:
Params:
| Name | Type | Default | Description |
|---|---|---|---|
| x | number | string | null | X-coordinate. |
| y | number | string | null | Y-coordinate. |
| width | number | string | null | Width. |
| height | number | string | null | Height. |
Returns:
anychart.charts.Stock - Self instance for method chaining.Try it:
cancelMarquee
Returns:
anychart.charts.Stock - Self instance for method chaining.container
Params:
| Name | Type | Description |
|---|---|---|
| element | anychart.graphics.vector.Layer | anychart.graphics.vector.Stage | string | Element | The value to set. |
Returns:
anychart.charts.Stock - Self instance for method chaining.Try it:
contextMenu
- null/boolean - disable or enable context menu.
- object - sets context menu settings.
Params:
| Name | Type | Description |
|---|---|---|
| settings | Object | boolean | null | Context menu settings |
Returns:
anychart.charts.Stock - Self instance for method chaining.credits
Sets chart credits settings depending on parameter type:
- null/boolean - disable or enable chart credits.
- object - sets chart credits settings.
Params:
| Name | Type | Default | Description |
|---|---|---|---|
| settings | Object | boolean | null | true | Credits settings |
Returns:
anychart.charts.Stock - Self instance for method chaining.crosshair
The plot crosshair settings have a higher priority than the chart crosshair settings.
- null/boolean - disable or enable chart crosshair.
- object - sets chart crosshair settings.
Params:
| Name | Type | Description |
|---|---|---|
| settings | Object | boolean | null | Crosshair settings. |
Returns:
anychart.charts.Stock - Self instance for method chaining.draw
Params:
| Name | Type | Description |
|---|---|---|
| async | boolean | Whether do draw asynchronously. If set to true, the chart will be drawn asynchronously. |
Returns:
anychart.charts.Stock - Self instance for method chaining.Try it:
eventMarkers
Returns:
anychart.core.stock.eventMarkers.Controller - Chart controller instance.Try it:
Params:
| Name | Type | Default | Description |
|---|---|---|---|
| settings | Object | boolean | null | true | Value to set. |
Returns:
anychart.charts.Stock - Self instance for method chaining.Try it:
exports
Returns:
anychart.core.utils.Exports - Exports settings.var exports = chart.exports();
Params:
| Name | Type | Description |
|---|---|---|
| settings | Object | Export settings. |
Returns:
anychart.charts.Stock - Self instance for method chaining.Try it:
fullScreen
Returns:
boolean - Full screen state (enabled/disabled).var fullScreen = chart.fullScreen();
Params:
| Name | Type | Default | Description |
|---|---|---|---|
| enabled | boolean | false | Enable/Disable fullscreen mode. |
Returns:
anychart.charts.Stock - Self instance for method chaining.Try it:
getJpgBase64String
Params:
| Name | Type | Description |
|---|---|---|
| onSuccessOrOptions | function(response:string) | Object | Function that is called when sharing is complete or object with options. |
| onError | function(response:string) | Function that is called if sharing fails. |
| width | number | Image width. |
| height | number | Image height. |
| quality | number | Image quality in ratio 0-1. |
| forceTransparentWhite | boolean | Force transparent to white or not. |
Try it:
getPdfBase64String
Params:
| Name | Type | Description |
|---|---|---|
| onSuccessOrOptions | function(response:string) | Object | Function that is called when sharing is complete or object with options. |
| onError | function(response:string) | Function that is called if sharing fails. |
| paperSizeOrWidth | number | string | Any paper format like 'a0', 'tabloid', 'b4', etc. |
| landscapeOrWidth | number | boolean | Define, is landscape. |
| x | number | Offset X. |
| y | number | Offset Y. |
Try it:
getPixelBounds
Returns pixel bounds of the chart due to parent bounds and self bounds settings.
Returns:
anychart.math.Rect - Pixel bounds of the chart.Try it:
getPlotsCount
Note: The getPlotsCount() method returns the number of existing plots.
The number of plots is not always equal to the biggest index of the plot. Please make sure you are aware of that when you dispose and create plots.
Returns:
number - Number of plots.// Creates plots with indexes 0 and 4 accordingly. var plot1 = chart.plot(0); var plot2 = chart.plot(4); // Returns the number of plots is 2. var plotsCount = chart.getPlotsCount();
Try it:
getPngBase64String
Params:
| Name | Type | Description |
|---|---|---|
| onSuccessOrOptions | function(response:string) | Object | Function that is called when sharing is complete or object with options. |
| onError | function(response:string) | Function that is called if sharing fails. |
| width | number | Image width. |
| height | number | Image height. |
| quality | number | Image quality in ratio 0-1. |
Try it:
getSelectedRange
Returns:
anychart.charts.Stock.SelectedRange - The object of the selected range.Try it:
getSvgBase64String
Params:
| Name | Type | Description |
|---|---|---|
| onSuccessOrOptions | function(response:string) | Object | Function that is called when sharing is complete or object with options. |
| onError | function(response:string) | Function that is called if sharing fails. |
| paperSizeOrWidth | string | number | Paper Size or width. |
| landscapeOrHeight | boolean | string | Landscape or height. |
Try it:
getType
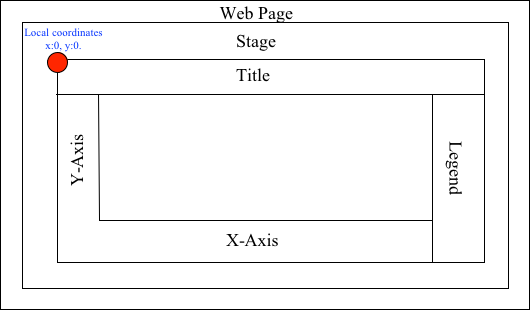
globalToLocal
On the image below, the red point is a starting point of the chart bounds. Local coordinates work only within the area of the stage (container).
Params:
| Name | Type | Description |
|---|---|---|
| xCoord | number | Global X coordinate. |
| yCoord | number | Global Y coordinate. |
Returns:
Object.<string, number> - Object with XY coordinates.Try it:
grouping
Returns:
anychart.core.stock.Grouping - Grouping settings.Try it:
- null/boolean - disable or enable data grouping.
- object - sets data grouping settings.
- array - sets data grouping settings.
Params:
| Name | Type | Description |
|---|---|---|
| settings | boolean | Array.<(string|anychart.core.stock.Grouping.Level)> | Object | Grouping value. |
Returns:
anychart.charts.Stock - Self instance for method chaining.height
Returns:
number | string | undefined - Chart's height setting.var height = chart.height();
Params:
| Name | Type | Default | Description |
|---|---|---|---|
| height | number | string | null | null | Height settings for the chart. |
Returns:
anychart.charts.Stock - Self instance for method chaining.Try it:
id
Params:
| Name | Type | Description |
|---|---|---|
| id | string | Chart id. |
Returns:
anychart.charts.Stock - Self instance for method chaining.Try it:
inMarquee
Returns:
boolean - Returns true if there is a marquee process running.interactivity
Returns:
anychart.core.utils.StockInteractivity - Interactivity settings.Try it:
Params:
| Name | Type | Description |
|---|---|---|
| settings | Object | anychart.enums.HoverMode | string | Settings object or boolean value like enabled state. |
Returns:
anychart.core.SeparateChart - Self instance for method chaining.Try it:
isFullScreenAvailable
Returns:
boolean - isFullScreenAvailable state.Try it:
label
Params:
| Name | Type | Default | Description |
|---|---|---|---|
| index | string | number | 0 | Index of instance. |
Returns:
anychart.core.ui.Label - An instance of class.Try it:
- null/boolean - disable or enable chart label.
- string - sets chart label text value.
- object - sets chart label settings.
Params:
| Name | Type | Default | Description |
|---|---|---|---|
| settings | null | boolean | Object | string | false | Chart label instance to add by index 0. |
Returns:
anychart.charts.Stock - Self instance for method chaining.- null/boolean - disable or enable chart label.
- string - sets chart label text value.
- object - sets chart label settings.
Params:
| Name | Type | Default | Description |
|---|---|---|---|
| index | string | number | 0 | Label index. |
| settings | null | boolean | Object | string | false | Chart label settings. |
Returns:
anychart.charts.Stock - Self instance for method chaining.left
Returns:
number | string | undefined - Chart's left bound setting.var left = chart.left();
Params:
| Name | Type | Default | Description |
|---|---|---|---|
| value | number | string | null | null | Left bound setting for the chart. |
Returns:
anychart.charts.Stock - Self instance for method chaining.Try it:
listen
Note: Notice that if the existing listener is one-off (added using listenOnce), it will cease to be such after calling the listen() method.
Params:
| Name | Type | Default | Description |
|---|---|---|---|
| type | string | The event type id. | |
| listener | function(e:Object) | Callback method.
Function that looks like: function(event){
// event.actualTarget - actual event target
// event.currentTarget - current event target
// event.iterator - event iterator
// event.originalEvent - original event
// event.point - event point
// event.pointIndex - event point index
} | |
| useCapture | boolean | false | Whether to fire in capture phase. Learn more about capturing https://javascript.info/bubbling-and-capturing |
| listenerScope | Object | Object in whose scope to call the listener. |
Returns:
Object - Unique key for the listener.Try it:
listenOnce
If the event handler being added already exists, listenOnce will do nothing.
Note: In particular, if the handler is already registered using listen(), listenOnce() will not make it one-off. Similarly, if a one-off listener already exists, listenOnce will not change it (it wil remain one-off).
Params:
| Name | Type | Default | Description |
|---|---|---|---|
| type | string | The event type id. | |
| listener | function(e:Object) | Callback method. | |
| useCapture | boolean | false | Whether to fire in capture phase. Learn more about capturing https://javascript.info/bubbling-and-capturing |
| listenerScope | Object | Object in whose scope to call the listener. |
Returns:
Object - Unique key for the listener.Try it:
localToGlobal
On the image below, the red point is a starting point of the chart bounds. Local coordinates work only within the area of the stage (container).
Params:
| Name | Type | Description |
|---|---|---|
| xCoord | number | Local X coordinate. |
| yCoord | number | Local Y coordinate. |
Returns:
Object.<string, number> - Object with XY coordinates.Try it:
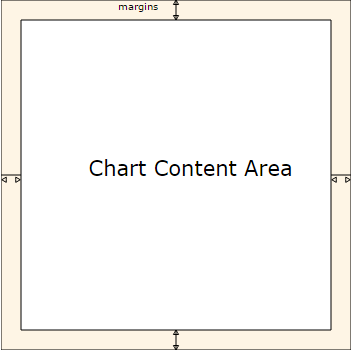
margin
Returns:
anychart.core.utils.Margin - Chart margin.Try it:
Params:
| Name | Type | Default | Description |
|---|---|---|---|
| margin | Array.<(number|string)> | Object | {top: 0, right: 0, bottom: 0, left: 0} | Value to set. |
Returns:
anychart.charts.Stock - Self instance for method chaining.// all margins 15px
chart.margin(15);
// all margins 15px
chart.margin('15px');
// top and bottom 5px, right and left 15px
chart.margin(anychart.utils.margin(5, 15));Try it:
Params:
| Name | Type | Default | Description |
|---|---|---|---|
| value1 | string | number | 0 | Top or top-bottom space. |
| value2 | string | number | 0 | Right or right-left space. |
| value3 | string | number | 0 | Bottom space. |
| value4 | string | number | 0 | Left space. |
Returns:
anychart.charts.Stock - Self instance for method chaining.// 1) all 10px chart.margin(10); // 2) top and bottom 10px, left and right 15px chart.margin(10, '15px'); // 3) top 10px, left and right 15px, bottom 5px chart.margin(10, '15px', 5); // 4) top 10px, right 15px, bottom 5px, left 12px chart.margin(10, '15px', '5px', 12);
Try it:
maxHeight
Returns:
number | string | null - Chart's maximum height.var maxHeight = chart.maxHeight();
Params:
| Name | Type | Default | Description |
|---|---|---|---|
| maxHeight | number | string | null | null | Maximum height to set. |
Returns:
anychart.charts.Stock - Self instance for method chaining.Try it:
maxWidth
Returns:
number | string | null - Chart's maximum width.var maxWidth = chart.maxWidth();
Params:
| Name | Type | Default | Description |
|---|---|---|---|
| maxWidth | number | string | null | null | Maximum width to set. |
Returns:
anychart.charts.Stock - Self instance for method chaining.Try it:
minHeight
Returns:
number | string | null - Chart's minimum height.var minHeight = chart.minHeight();
Params:
| Name | Type | Default | Description |
|---|---|---|---|
| minHeight | number | string | null | null | Minimum height to set. |
Returns:
anychart.charts.Stock - Self instance for method chaining.Try it:
minWidth
Returns:
number | string | null - Chart's minimum width.var minWidth = chart.minWidth();
Params:
| Name | Type | Default | Description |
|---|---|---|---|
| minWidth | number | string | null | null | Minimum width to set. |
Returns:
anychart.charts.Stock - Self instance for method chaining.Try it:
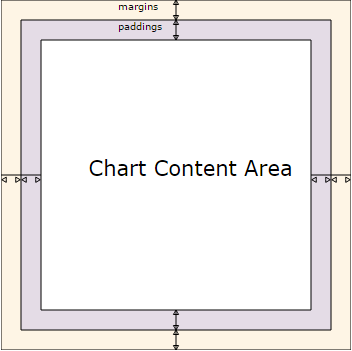
padding
Returns:
anychart.core.utils.Padding - Chart padding.Try it:
Params:
| Name | Type | Default | Description |
|---|---|---|---|
| padding | Array.<(number|string)> | Object | {top: 0, right: 0, bottom: 0, left: 0} | Value to set. |
Returns:
anychart.charts.Stock - Self instance for method chaining.chart.padding([5, 15]);
or
chart.padding({left: 10, top: 20, bottom: 30, right: '40%'}});Try it:
Params:
| Name | Type | Default | Description |
|---|---|---|---|
| value1 | string | number | 0 | Top or top-bottom space. |
| value2 | string | number | 0 | Right or right-left space. |
| value3 | string | number | 0 | Bottom space. |
| value4 | string | number | 0 | Left space. |
Returns:
anychart.charts.Stock - Self instance for method chaining.// 1) all 10px chart.padding(10); // 2) top and bottom 10px, left and right 15px chart.padding(10, "15px"); // 3) top 10px, left and right 15px, bottom 5px chart.padding(10, "15px", 5); // 4) top 10px, right 15%, bottom 5px, left 12px chart.padding(10, "15%", "5px", 12);
Try it:
plot
Params:
| Name | Type | Description |
|---|---|---|
| index | number | Index of plot. |
Returns:
anychart.core.stock.Plot - Plot instance.Try it:
- null/boolean - disable or enable chart plot.
- object - sets chart plot settings.
Params:
| Name | Type | Description |
|---|---|---|
| settings | Object | boolean | null | Value to set |
Returns:
anychart.charts.Stock - Self instance for method chaining.- null/boolean - disable or enable chart plot by index.
- object - sets chart plot settings by index.
Params:
| Name | Type | Default | Description |
|---|---|---|---|
| index | number | Index of plot. | |
| settings | Object | boolean | null | false | Plot settings to set. |
Returns:
anychart.charts.Stock - Self instance for method chaining.preserveSelectedRangeOnDataUpdate
Returns:
boolean - Selected Range Change Behaviour.var state = chart.preserveSelectedRangeOnDataUpdate();
Params:
| Name | Type | Default | Description |
|---|---|---|---|
| enabled | boolean | false | Enable/disable selected range change behaviour. |
Returns:
anychart.charts.Stock - Self instance for method chaining.Try it:
Params:
| Name | Type | Default | Description |
|---|---|---|---|
| paperSize | anychart.graphics.vector.PaperSize | Paper size. | |
| landscape | boolean | false | Flag of landscape. |
Try it:
removeAllListeners
Params:
| Name | Type | Description |
|---|---|---|
| type | string | Type of event to remove, default is to remove all types. |
Returns:
number - Number of listeners removed.Try it:
right
Returns:
number | string | undefined - Chart's right bound setting.var right = chart.right();
Params:
| Name | Type | Default | Description |
|---|---|---|---|
| value | number | string | null | null | Right bound setting for the chart. |
Returns:
anychart.charts.Stock - Self instance for method chaining.Try it:
saveAsCsv
Params:
| Name | Type | Description |
|---|---|---|
| chartDataExportMode | anychart.enums.ChartDataExportMode | string | Data export mode. |
| csvSettings | Object.<string, (string|boolean|undefined|function(name:*, value:*))> | CSV settings object:
Formatters must be represented as one of:
|
| filename | string | File name to save. |
Try it:
saveAsJpg
Params:
| Name | Type | Description |
|---|---|---|
| width | number | Image width. |
| height | number | Image height. |
| quality | number | Image quality in ratio 0-1. |
| forceTransparentWhite | boolean | Define, should we force transparent to white background. |
| filename | string | File name to save. |
Try it:
saveAsJson
Params:
| Name | Type | Description |
|---|---|---|
| filename | string | File name to save. |
Try it:
saveAsPdf
Params:
| Name | Type | Description |
|---|---|---|
| paperSize | string | Any paper format like 'a0', 'tabloid', 'b4', etc. |
| landscape | boolean | Define, is landscape. |
| x | number | Offset X. |
| y | number | Offset Y. |
| filename | string | File name to save. |
Try it:
saveAsPng
Params:
| Name | Type | Description |
|---|---|---|
| width | number | Image width. |
| height | number | Image height. |
| quality | number | Image quality in ratio 0-1. |
| filename | string | File name to save. |
Try it:
saveAsSvg
Params:
| Name | Type | Description |
|---|---|---|
| paperSize | string | Paper Size. |
| landscape | boolean | Landscape. |
| filename | string | File name to save. |
Try it:
Params:
| Name | Type | Description |
|---|---|---|
| width | number | Image width. |
| height | number | Image height. |
Try it:
saveAsXlsx
Params:
| Name | Type | Description |
|---|---|---|
| chartDataExportMode | anychart.enums.ChartDataExportMode | string | Data export mode. |
| filename | string | File name to save. |
| exportOptions | Object.<string, (function(name:*, value:*))> | Export options:
Formatter must be represented as one of:
|
Try it:
saveAsXml
Params:
| Name | Type | Description |
|---|---|---|
| filename | string | File name to save. |
Try it:
scroller
- null/boolean - disable or enable chart scroller.
- object - sets chart scroller settings by index.
Params:
| Name | Type | Default | Description |
|---|---|---|---|
| settings | Object | boolean | null | true | Scroller settings |
Returns:
anychart.charts.Stock - Self instance for method chaining.scrollerGrouping
Returns:
anychart.core.stock.Grouping - The scroller data grouping settings.Try it:
- null/boolean - disable or enable data grouping.
- object - sets data grouping settings.
- array - sets data grouping settings.
Params:
| Name | Type | Description |
|---|---|---|
| value | boolean | Array.<(string|anychart.core.stock.Grouping.Level)> | Object | Grouping value. |
Returns:
anychart.charts.Stock - Self instance for method chaining.selectRange
Selects passed range and initiates data redraw.
Params:
| Name | Type | Description |
|---|---|---|
| start | number | string | Date | Start value to set. |
| end | number | string | Date | End value to set. |
Returns:
anychart.charts.Stock - Self instance for method chaining.Try it:
Selects passed range and initiates data redraw.
Params:
| Name | Type | Description |
|---|---|---|
| start | number | string | Date | Start value to set. |
| end | number | string | Date | End value to set. |
| dispatchEvent | boolean | Whether to enable dispatch event. |
Returns:
anychart.charts.Stock - Self instance for method chaining.Try it:
Note: Unit value and range type value works only after anychart.charts.Stock#draw is called.
Params:
| Name | Type | Description |
|---|---|---|
| type | anychart.enums.StockRangeType | string | Range type to set. |
| count | number | Count of points to set. |
| dispatchEvent | boolean | Whether to enable dispatch event. |
Returns:
anychart.charts.Stock - Self instance for method chaining.Try it:
Note: Unit value and range type value works only after anychart.charts.Stock#draw is called.
Params:
| Name | Type | Description |
|---|---|---|
| unit | anychart.enums.Interval | string | Interval to set. |
| count | number | Count of years. |
| anchor | anychart.enums.StockRangeAnchor | string | Range anchor to set. |
| dispatchEvent | boolean | Whether to enable dispatch event. |
Returns:
anychart.charts.Stock - Self instance for method chaining.Try it:
shareAsJpg
shareAsPdf
shareAsPng
shareAsSvg
shareWithFacebook
shareWithLinkedIn
shareWithPinterest
shareWithTwitter
splitters
Returns:
anychart.core.stock.splitters.Settings - Chart splitters settings.Try it:
Params:
| Name | Type | Default | Description |
|---|---|---|---|
| settings | boolean | Object | true | Chart splitters settings. |
Returns:
anychart.charts.Stock - Self instance for method chaining.Try it:
startZoomMarquee
Params:
| Name | Type | Description |
|---|---|---|
| repeat | boolean | Stay in marquee select mode after or not. |
| asRect | boolean | If true - a rectangle is drawn by X and Y coordinates, otherwise, draws an area of the plot height. |
Returns:
anychart.charts.Stock - Self instance for method chaining.Try it:
title
- null/boolean - disable or enable chart title.
- string - sets chart title text value.
- object - sets chart title settings.
Params:
| Name | Type | Default | Description |
|---|---|---|---|
| settings | null | boolean | Object | string | false | Chart title text or title instance for copy settings from. |
Returns:
anychart.charts.Stock - Self instance for method chaining.toA11yTable
Params:
| Name | Type | Description |
|---|---|---|
| title | string | Title to set. |
| asString | boolean | Defines output: HTML string if True, DOM element if False. |
Returns:
Element | string | null - HTML table instance with a11y style (invisible), HTML string or null if parsing chart to table fails.Try it:
toCsv
Params:
| Name | Type | Description |
|---|---|---|
| chartDataExportMode | anychart.enums.ChartDataExportMode | string | Data export mode. |
| csvSettings | Object.<string, (string|boolean|undefined|function(name:*, value:*)|Object)> | CSV settings. CSV settings object: rowsSeparator - string or undefined (default is '\n') columnsSeparator - string or undefined (default is ',') ignoreFirstRow - boolean or undefined (default is 'false') formats - 1) a function with two arguments such as the field name and value, that returns the formatted value or 2) the object with the key as the field name, and the value as a format function. (default is 'undefined'). |
Returns:
string - CSV string.Try it:
toHtmlTable
Params:
| Name | Type | Description |
|---|---|---|
| title | string | Title to set. |
| asString | boolean | Defines output: HTML string if True, DOM element if False. |
Returns:
Element | string | null - HTML table instance, HTML string or null if parsing chart to table fails.Try it:
toSvg
Params:
| Name | Type | Description |
|---|---|---|
| paperSize | string | Paper Size. |
| landscape | boolean | Landscape. |
Returns:
string - SVG content or empty string.Try it:
Params:
| Name | Type | Description |
|---|---|---|
| width | number | Image width. |
| height | number | Image height. |
Returns:
string - SVG content or empty string.Try it:
tooltip
- null/boolean - disable or enable chart data tooltip.
- object - sets chart data tooltip settings.
Params:
| Name | Type | Default | Description |
|---|---|---|---|
| settings | Object | boolean | null | true | Tooltip settings. |
Returns:
anychart.charts.Stock - Self instance for method chaining.top
Returns:
number | string | undefined - Chart's top bound settings.var top = chart.top();
Params:
| Name | Type | Description |
|---|---|---|
| top | number | string | null | Top bound for the chart. |
Returns:
anychart.charts.Stock - Self instance for method chaining.Try it:
unlisten
Params:
| Name | Type | Default | Description |
|---|---|---|---|
| type | string | The event type id. | |
| listener | function(e:Object) | Callback method. | |
| useCapture | boolean | false | Whether to fire in capture phase. Learn more about capturing https://javascript.info/bubbling-and-capturing |
| listenerScope | Object | Object in whose scope to call the listener. |
Returns:
boolean - Whether any listener was removed.Try it:
unlistenByKey
Params:
| Name | Type | Description |
|---|---|---|
| key | Object | The key returned by listen() or listenOnce(). |
Returns:
boolean - Whether any listener was removed.Try it:
width
Returns:
number | string | undefined - Chart's width setting.var width = chart.width();
Params:
| Name | Type | Default | Description |
|---|---|---|---|
| width | number | string | null | null | Width settings for the chart. |
Returns:
anychart.charts.Stock - Self instance for method chaining.Try it:
xScale
Returns:
anychart.scales.StockScatterDateTime - Default chart scale value.Try it:
Params:
| Name | Type | Default | Description |
|---|---|---|---|
| settings | anychart.enums.ScaleTypes | string | Object | anychart.scales.StockOrdinalDateTime | X-scale to set. |
Returns:
anychart.charts.Stock - Self instance for method chaining.Try it:
zIndex
Returns:
number - Chart Z-index.var zIndex = chart.zIndex();
Params:
| Name | Type | Default | Description |
|---|---|---|---|
| zIndex | number | 0 | Z-index to set. |
Returns:
anychart.charts.Stock - Self instance for method chaining.Try it:
zoomMarqueeFill
Returns:
anychart.graphics.vector.Fill - Zoom marquee fill.var zoomMarqueeFill = chart.zoomMarqueeFill();
Params:
| Name | Type | Description |
|---|---|---|
| color | anychart.graphics.vector.Fill | Array.<(anychart.graphics.vector.GradientKey|string)> | Color as an object, an array or a string. |
Returns:
anychart.charts.Stock - Self instance for method chaining.Params:
| Name | Type | Description |
|---|---|---|
| color | string | Color as a string. |
| opacity | number | Color opacity. |
Returns:
anychart.charts.Stock - Self instance for method chaining.Try it:
Params:
| Name | Type | Description |
|---|---|---|
| keys | Array.<(anychart.graphics.vector.GradientKey|string)> | Gradient keys. |
| angle | number | Gradient angle. |
| mode | boolean | anychart.graphics.vector.Rect | Object | Gradient mode. |
| opacity | number | Gradient opacity. |
Returns:
anychart.charts.Stock - Self instance for method chaining.Try it:
Params:
| Name | Type | Description |
|---|---|---|
| keys | Array.<(anychart.graphics.vector.GradientKey|string)> | Color-stop gradient keys. |
| cx | number | X ratio of center radial gradient. |
| cy | number | Y ratio of center radial gradient. |
| mode | anychart.graphics.math.Rect | If defined then userSpaceOnUse mode, else objectBoundingBox. |
| opacity | number | Opacity of the gradient. |
| fx | number | X ratio of focal point. |
| fy | number | Y ratio of focal point. |
Returns:
anychart.charts.Stock - Self instance for method chaining.Try it:
Params:
| Name | Type | Description |
|---|---|---|
| imageSettings | anychart.graphics.vector.Fill | Object with settings. |
Returns:
anychart.charts.Stock - Self instance for method chaining.Try it:
zoomMarqueeStroke
Returns:
anychart.graphics.vector.Stroke - Zoom marquee stroke.var zoomMarqueeStroke = chart.zoomMarqueeStroke();
Params:
| Name | Type | Default | Description |
|---|---|---|---|
| color | anychart.graphics.vector.Stroke | anychart.graphics.vector.ColoredFill | string | null | Stroke settings. | |
| thickness | number | 1 | Line thickness. |
| dashpattern | string | Controls the pattern of dashes and gaps used to stroke paths. | |
| lineJoin | string | anychart.graphics.vector.StrokeLineJoin | Line join style. | |
| lineCap | string | anychart.graphics.vector.StrokeLineCap | Line cap style. |
Returns:
anychart.charts.Stock - Self instance for method chaining.Try it: