
class anychart.charts.Cartesian Improve this Doc
Extends: anychart.core.SeparateChart
Cartesian chart class.
To get the chart use any of these methods:
Methods Overview
| Specific settings | |
| a11y() | Accessibility settings. |
| annotations() | Creates annotations. |
| categorizedBySeries() | Categorization settings on the X axis |
| getType() | Definition of the chart type. |
| globalToLocal() | Converts the global coordinates to local coordinates. |
| localToGlobal() | Converts the local coordinates to global coordinates. |
| maxPointWidth() | Maximum point width settings. |
| minPointLength() | Minimum point length settings. |
| pointWidth() | Point width settings. |
| toA11yTable() | Creates and returns the chart represented as an invisible HTML table. |
| toHtmlTable() | Creates and returns a chart as HTML table. |
| Axes and Scales | |
| baseline() | Set the baseline by the Y-Scale value. |
| getXAxesCount() | Returns the number of X-axes. |
| getXScales() | Returns chart X scales. |
| getYAxesCount() | Returns the number of Y-axes. |
| getYScales() | Returns chart Y scales. |
| lineMarker() | Line marker settings. |
| rangeMarker() | Range marker settings. |
| textMarker() | Text marker settings. |
| xAxis() | X-axis settings. |
| xGrid() | Grid settings. |
| xMinorGrid() | Minor grid settings. |
| xScale() | X-scale settings. |
| yAxis() | Y-axis settings. |
| yGrid() | Grid settings. |
| yMinorGrid() | Minor grid settings. |
| yScale() | Y-scale settings. |
| Chart Coloring | |
| animation() | Animation settings |
| background() | Background settings. |
| dataArea() | Data area settings. |
| hatchFillPalette() | Hatch fill palette settings. |
| markerPalette() | Markers palette settings. |
| palette() | Palette settings. |
| Chart Controls | |
| contextMenu() | Context menu settings. |
| credits() | Credits settings |
| label() | Label settings. |
| legend() | Legend settings. |
| title() | Title settings. |
| xScroller() | Scroller settings. |
| yScroller() | Y scroller settings. |
| Coloring | |
| selectRectangleMarqueeFill() | Select marquee fill settings. |
| selectRectangleMarqueeStroke() | Stroke settings. |
| Data | |
| getSelectedPoints() | Getter for the selected points. |
| getStat() | Getter for a statistical value by the key. |
| noData() | NoData settings. |
| Events | |
| listen() | Adds an event listener. |
| listenOnce() | Adds a single time event listener. |
| removeAllListeners() | Removes all listeners. |
| unlisten() | Removes the listener. |
| unlistenByKey() | Removes the listener by the key. |
| Export | |
| exports() | Exports settings |
| print() | Prints chart. |
| saveAsCsv() | Saves chart data as a CSV file. |
| saveAsJpg() | Saves the chart as JPEG image. |
| saveAsJson() | Saves chart config as JSON document. |
| saveAsPng() | Saves the chart as PNG image. |
| saveAsSvg() | Saves the chart as SVG image. |
| saveAsXlsx() | Saves chart data as an Excel document. |
| saveAsXml() | Saves chart config as XML document. |
| shareWithFacebook() | Opens Facebook sharing dialog. |
| shareWithLinkedIn() | Opens LinkedIn sharing dialog. |
| shareWithPinterest() | Opens Pinterest sharing dialog. |
| shareWithTwitter() | Opens Twitter sharing dialog. |
| toCsv() | Returns CSV string with the chart data. |
| toSvg() | Returns SVG string. |
| Interactivity | |
| crosshair() | Crosshair settings. |
| hovered() | Hovered state settings. |
| interactivity() | Interactivity settings. |
| normal() | Normal state settings. |
| selected() | Selected state settings. |
| startSelectRectangleMarquee() | Starts select marquee drawing. |
| tooltip() | Tooltip settings. |
| xZoom() | Zoom settings. |
| yZoom() | Y zoom settings. |
| Point Elements | |
| labels() | Labels settings. |
| maxLabels() | Maximum labels settings. |
| minLabels() | Minimum labels settings. |
| Series | |
| area() | Adds Area series. |
| bar() | Adds Bar series. |
| box() | Adds Box series. |
| bubble() | Adds Bubble series. |
| candlestick() | Adds Candlestick series. |
| column() | Adds Column series. |
| hilo() | Adds HiLo series. |
| jumpLine() | Adds Jump Line series. |
| line() | Adds Line series. |
| marker() | Adds Marker series. |
| ohlc() | Adds OHLC series. |
| rangeArea() | Adds Range Area series. |
| rangeBar() | Adds Range Bar series. |
| rangeColumn() | Adds Range Column series. |
| rangeSplineArea() | Adds Range Spline Area series. |
| rangeStepArea() | Adds Range Step Area series. |
| spline() | Adds Spline series. |
| splineArea() | Adds Spline Area series. |
| stepArea() | Adds Step Area series. |
| stepLine() | Adds Step Line series. |
| stick() | Adds Stick series. |
| Size and Position | |
| bottom() | Bottom bound setting. |
| bounds() | Bounds settings. |
| getPixelBounds() | Returns pixel bounds of the chart. |
| getPlotBounds() | Returns data bounds of the chart. |
| height() | Height setting. |
| left() | Left bound setting. |
| margin() | Margin settings. |
| maxHeight() | Maximum height setting. |
| maxWidth() | Maximum width setting. |
| minHeight() | Minimum height setting. |
| minWidth() | Minimum width setting. |
| padding() | Padding settings. |
| right() | Right bound setting. |
| top() | Top bound setting. |
| width() | Width setting. |
| zIndex() | Z-index of the chart. |
| Specific Series Settings | |
| addSeries() | Adds series to the chart. |
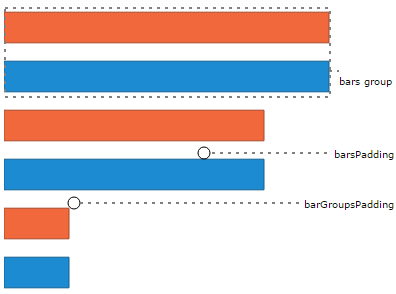
| barGroupsPadding() | Settings for the space between bar groups. |
| barsPadding() | Settings for the space between bars. |
| defaultSeriesType() | Default series type. |
| getSeries() | Returns series by id. |
| getSeriesAt() | Returns series by index. |
| getSeriesCount() | Returns the number of series in a chart. |
| maxBubbleSize() | Maximum size for all bubbles on the charts. |
| minBubbleSize() | Minimum size for all bubbles on the charts. |
| removeAllSeries() | Removes all series from chart. |
| removeSeries() | Removes one of series from chart by its id. |
| removeSeriesAt() | Removes one of series from chart by its index. |
| XML/JSON | |
| toJson() | Returns chart configuration as JSON object or string. |
| toXml() | Returns chart configuration as XML string or XMLNode. |
| Miscellaneous | |
| autoRedraw() | Redraw chart after changes or not. |
| cancelMarquee() | Stops marquee action if any. |
| container() | Chart container |
| data() | Getter for the data. |
| draw() | Chart drawing. |
| fullScreen() | Fullscreen mode. |
| getJpgBase64String() | Returns JPG as base64 string. |
| getPdfBase64String() | Returns PDF as base64 string. |
| getPngBase64String() | Returns PNG as base64 string. |
| getSvgBase64String() | Returns SVG as base64 string. |
| id() | Chart id. |
| inMarquee() | Gets marquee process running value. |
| isFullScreenAvailable() | Whether the fullscreen mode available in the browser or not. |
| isVertical() | Getter for the layout direction. |
| saveAsPdf() | Saves the chart as PDF image. |
| shareAsJpg() | Shares a chart as a JPG file and returns a link to the shared image. |
| shareAsPdf() | Shares a chart as a PDF file and returns a link to the shared image. |
| shareAsPng() | Shares a chart as a PNG file and returns a link to the shared image. |
| shareAsSvg() | Shares a chart as a SVG file and returns a link to the shared image. |
Methods Description
a11y
Returns:
anychart.core.utils.ChartA11y - Accessibility settings object.var stateOfAccsessibility = chart.a11y();
Sets accessibility setting depending on parameter type:
- boolean - disable or enable accessibility.
- object - sets accessibility setting.
Params:
| Name | Type | Description |
|---|---|---|
| settings | boolean | Object | Whether to enable accessibility or object with settings. |
Returns:
anychart.charts.Cartesian - Self instance for method chaining.addSeries
Params:
| Name | Type | Description |
|---|---|---|
| var_args | anychart.data.View | anychart.data.Set | Array | Chart series data. |
Returns:
Array.<anychart.core.cartesian.series.Base> - Array of created series.Try it:
animation
Returns:
anychart.core.utils.Animation - Returns true if the animation is enabled.Try it:
- null/boolean - disable or enable animation.
- object - sets animation settings.
Params:
| Name | Type | Default | Description |
|---|---|---|---|
| settings | boolean | Object | false | Whether to enable animation. |
Returns:
anychart.charts.Cartesian - Self instance for method chaining.Params:
| Name | Type | Default | Description |
|---|---|---|---|
| enabled | boolean | false | Whether to enable animation. |
| duration | number | 1000 | Duration in milliseconds. |
Returns:
anychart.charts.Cartesian - Self instance for method chaining.Try it:
annotations
Returns:
anychart.core.annotations.PlotController - The plot annotations.Try it:
Params:
| Name | Type | Description |
|---|---|---|
| annotationsList | Array | Annotations list to set. |
Returns:
anychart.charts.Cartesian - Self instance for method chainingTry it:
area
Params:
| Name | Type | Description |
|---|---|---|
| data | anychart.data.View | anychart.data.Set | Array | Data for the series. |
| csvSettings | anychart.enums.TextParsingMode | string | anychart.data.TextParsingSettings | If CSV string is passed, you can pass CSV parser settings here as a hash map. |
Returns:
anychart.core.cartesian.series.Area - An instance of the created series.Try it:
autoRedraw
Flag whether to automatically call chart.draw() on any changes or not.
Returns:
boolean - AutoRedraw flag.var autoRedraw = chart.autoRedraw();
Flag whether to automatically call chart.draw() on any changes or not.
Params:
| Name | Type | Default | Description |
|---|---|---|---|
| enabled | boolean | true | Value to set. |
Returns:
anychart.charts.Cartesian - Self instance for method chaining.Try it:
background
- null/boolean - disable or enable chart background.
- object - sets chart background settings.
- string - sets chart background color.
Params:
| Name | Type | Description |
|---|---|---|
| settings | string | Object | null | boolean | Background settings to set. |
Returns:
anychart.charts.Cartesian - Self instance for method chaining.bar
Params:
| Name | Type | Description |
|---|---|---|
| data | anychart.data.View | anychart.data.Set | Array | string | Data for the series. |
| csvSettings | anychart.enums.TextParsingMode | string | anychart.data.TextParsingSettings | If CSV string is passed, you can pass CSV parser settings here as a hash map. |
Returns:
anychart.core.cartesian.series.Bar - An instance of the created series.Try it:
barGroupsPadding
Returns:
number - Bar groups padding.Try it:
See illustration at anychart.charts.Cartesian#barsPadding.
Params:
| Name | Type | Default | Description |
|---|---|---|---|
| padding | number | 0.8 | Value to set. |
Returns:
anychart.charts.Cartesian - Self instance for method chaining.Try it:
barsPadding
Returns:
number - Bars padding.Try it:
Params:
| Name | Type | Default | Description |
|---|---|---|---|
| padding | number | 0.4 | Value to set. |
Returns:
anychart.charts.Cartesian - Self instance for method chaining.Try it:
baseline
Returns:
number - The baseline value by the Y-Scale.var chart = anychart.line(); var baseline = chart.baseline();
The baseline is the line relative to which the series with the negative or positive value is drawn and painted over.
Params:
| Name | Type | Description |
|---|---|---|
| value | number | Y-Scale value for the baseline. |
Returns:
anychart.charts.Cartesian - Self instance for method chaining.Try it:
bottom
Returns:
number | string | undefined - Chart's bottom bound setting.var chart = anychart.cartesian(); chart.line([10, 4, 17, 20, 16, 35, 6, 15]); var bottom = chart.bottom();
Params:
| Name | Type | Default | Description |
|---|---|---|---|
| value | number | string | null | null | Bottom bound setting for the chart. |
Returns:
anychart.charts.Cartesian - Self instance for method chaining.Try it:
bounds
Returns:
anychart.core.utils.Bounds - Bounds of the element.var chart = anychart.cartesian(); chart.line([10, 4, 17, 20, 16, 35, 6, 15]); var bounds = chart.bounds();
Params:
| Name | Type | Description |
|---|---|---|
| bounds | anychart.utils.RectObj | anychart.math.Rect | anychart.core.utils.Bounds | Bounds of teh chart. |
Returns:
anychart.charts.Cartesian - Self instance for method chaining.Try it:
Params:
| Name | Type | Default | Description |
|---|---|---|---|
| x | number | string | null | X-coordinate. |
| y | number | string | null | Y-coordinate. |
| width | number | string | null | Width. |
| height | number | string | null | Height. |
Returns:
anychart.charts.Cartesian - Self instance for method chaining.Try it:
box
Params:
| Name | Type | Description |
|---|---|---|
| data | anychart.data.View | anychart.data.Set | Array | string | Data for the series. |
| csvSettings | anychart.enums.TextParsingMode | string | anychart.data.TextParsingSettings | If CSV string is passed, you can pass CSV parser settings here as a hash map. |
Returns:
anychart.core.cartesian.series.Box - An instance of the created series.Try it:
bubble
Params:
| Name | Type | Description |
|---|---|---|
| data | anychart.data.View | anychart.data.Set | Array | string | Data for the series. |
| csvSettings | anychart.enums.TextParsingMode | string | anychart.data.TextParsingSettings | If CSV string is passed, you can pass CSV parser settings here as a hash map. |
Returns:
anychart.core.cartesian.series.Bubble - An instance of the created series.Try it:
cancelMarquee
Returns:
anychart.charts.Cartesian - Self instance for method chaining.candlestick
Params:
| Name | Type | Description |
|---|---|---|
| data | anychart.data.View | anychart.data.Set | Array | string | Data for the series. |
| csvSettings | anychart.enums.TextParsingMode | string | anychart.data.TextParsingSettings | If CSV string is passed, you can pass CSV parser settings here as a hash map. |
Returns:
anychart.core.cartesian.series.Candlestick - An instance of the created series.Try it:
categorizedBySeries
Returns:
boolean - Categorize by series names or by point names.var categorizedBySeries = chart.categorizedBySeries();
If you use categorizedBySeries(true) you should make sure series names are unique, otherwise it might lead to the unexpected behavior.
Note: works only with the ordinal scale.
Params:
| Name | Type | Default | Description |
|---|---|---|---|
| enabled | boolean | false | Whether to enable distribution by series or no. |
Returns:
anychart.charts.Cartesian - Self instance for method chaining.Try it:
column
Params:
| Name | Type | Description |
|---|---|---|
| data | anychart.data.View | anychart.data.Set | Array | string | Data for the series. |
| csvSettings | anychart.enums.TextParsingMode | string | anychart.data.TextParsingSettings | If CSV string is passed, you can pass CSV parser settings here as a hash map. |
Returns:
anychart.core.cartesian.series.Column - An instance of the created series.Try it:
container
Params:
| Name | Type | Description |
|---|---|---|
| element | anychart.graphics.vector.Layer | anychart.graphics.vector.Stage | string | Element | The value to set. |
Returns:
anychart.charts.Cartesian - Self instance for method chaining.Try it:
contextMenu
- null/boolean - disable or enable context menu.
- object - sets context menu settings.
Params:
| Name | Type | Description |
|---|---|---|
| settings | Object | boolean | null | Context menu settings |
Returns:
anychart.charts.Cartesian - Self instance for method chaining.credits
Sets chart credits settings depending on parameter type:
- null/boolean - disable or enable chart credits.
- object - sets chart credits settings.
Params:
| Name | Type | Default | Description |
|---|---|---|---|
| settings | Object | boolean | null | true | Credits settings |
Returns:
anychart.charts.Cartesian - Self instance for method chaining.crosshair
- null/boolean - disable or enable chart crosshair.
- object - sets chart crosshair settings.
Params:
| Name | Type | Default | Description |
|---|---|---|---|
| settings | Object | boolean | null | false | Crosshair settings. |
Returns:
anychart.charts.Cartesian - Self instance for method chaining.data
Params:
| Name | Type | Description |
|---|---|---|
| data | anychart.data.Set | anychart.data.DataSettings | Array | Data to set |
Returns:
anychart.charts.Cartesian - Self instance for method chaining.dataArea
The data area is drawn along the data bounds.
- boolean - disable or enable data area.
- object - sets data area settings.
Params:
| Name | Type | Description |
|---|---|---|
| settings | Object | boolean | Data area settings to set. |
Returns:
anychart.charts.Cartesian - Self instance for method chaining.defaultSeriesType
Returns:
anychart.enums.CartesianSeriesType | string - Default series type.Try it:
Params:
| Name | Type | Description |
|---|---|---|
| type | anychart.enums.CartesianSeriesType | string | Default series type. |
Returns:
anychart.charts.Cartesian - Self instance for method chaining.Try it:
draw
Params:
| Name | Type | Description |
|---|---|---|
| async | boolean | Whether do draw asynchronously. If set to true, the chart will be drawn asynchronously. |
Returns:
anychart.charts.Cartesian - Self instance for method chaining.Try it:
exports
Returns:
anychart.core.utils.Exports - Exports settings.var exports = chart.exports();
Params:
| Name | Type | Description |
|---|---|---|
| settings | Object | Export settings. |
Returns:
anychart.charts.Cartesian - Self instance for method chaining.Try it:
fullScreen
Returns:
boolean - Full screen state (enabled/disabled).var fullScreen = chart.fullScreen();
Params:
| Name | Type | Default | Description |
|---|---|---|---|
| enabled | boolean | false | Enable/Disable fullscreen mode. |
Returns:
anychart.charts.Cartesian - Self instance for method chaining.Try it:
getJpgBase64String
Params:
| Name | Type | Description |
|---|---|---|
| onSuccessOrOptions | function(response:string) | Object | Function that is called when sharing is complete or object with options. |
| onError | function(response:string) | Function that is called if sharing fails. |
| width | number | Image width. |
| height | number | Image height. |
| quality | number | Image quality in ratio 0-1. |
| forceTransparentWhite | boolean | Force transparent to white or not. |
Try it:
getPdfBase64String
Params:
| Name | Type | Description |
|---|---|---|
| onSuccessOrOptions | function(response:string) | Object | Function that is called when sharing is complete or object with options. |
| onError | function(response:string) | Function that is called if sharing fails. |
| paperSizeOrWidth | number | string | Any paper format like 'a0', 'tabloid', 'b4', etc. |
| landscapeOrWidth | number | boolean | Define, is landscape. |
| x | number | Offset X. |
| y | number | Offset Y. |
Try it:
getPixelBounds
Returns pixel bounds of the chart due to parent bounds and self bounds settings.
Returns:
anychart.math.Rect - Pixel bounds of the chart.Try it:
getPlotBounds
Note: Works only after anychart.charts.Cartesian#draw is called.
Returns:
anychart.math.Rect - Data bounds of the chart.Try it:
getPngBase64String
Params:
| Name | Type | Description |
|---|---|---|
| onSuccessOrOptions | function(response:string) | Object | Function that is called when sharing is complete or object with options. |
| onError | function(response:string) | Function that is called if sharing fails. |
| width | number | Image width. |
| height | number | Image height. |
| quality | number | Image quality in ratio 0-1. |
Try it:
getSelectedPoints
Returns:
Array.<anychart.core.Point> - An array of the selected points.Try it:
getSeries
Params:
| Name | Type | Default | Description |
|---|---|---|---|
| id | number | string | index | Id of the series. |
Returns:
anychart.core.cartesian.series.Base - An instance of the created series.Try it:
getSeriesAt
Params:
| Name | Type | Description |
|---|---|---|
| index | number | Index of the series. |
Returns:
anychart.core.cartesian.series.Base - An instance of the created series.Try it:
getSeriesCount
getStat
Params:
| Name | Type | Description |
|---|---|---|
| key | anychart.enums.Statistics | string | Key. |
Returns:
* - Statistics value.Try it:
getSvgBase64String
Params:
| Name | Type | Description |
|---|---|---|
| onSuccessOrOptions | function(response:string) | Object | Function that is called when sharing is complete or object with options. |
| onError | function(response:string) | Function that is called if sharing fails. |
| paperSizeOrWidth | string | number | Paper Size or width. |
| landscapeOrHeight | boolean | string | Landscape or height. |
Try it:
getType
getXAxesCount
Returns:
number - Number of X-axes.getXScales
Returns:
Array - An array of all X scales (including axes, grids, and axis markers scales).getYAxesCount
Returns:
number - Number of Y-axes.getYScales
Returns:
Array - An array of all Y scales (including axes, grids, and axis markers scales).Try it:
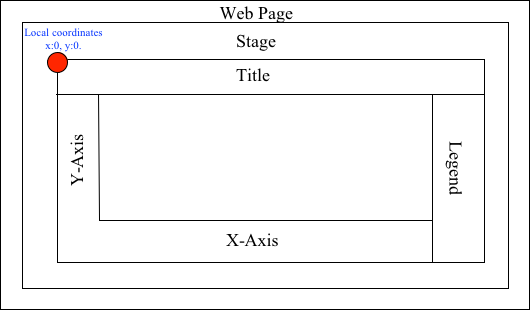
globalToLocal
On image below, the red point is a starting coordinate point of the chart bounds. Local coordinates work only in area of the stage (container).
Params:
| Name | Type | Description |
|---|---|---|
| xCoord | number | Global X coordinate. |
| yCoord | number | Global Y coordinate. |
Returns:
Object.<string, number> - Object with XY coordinates.Try it:
hatchFillPalette
Returns:
anychart.palettes.HatchFills - Chart hatch fill palette.Try it:
Params:
| Name | Type | Description |
|---|---|---|
| settings | Array.<anychart.graphics.vector.HatchFill.HatchFillType> | Object | anychart.palettes.HatchFills | Chart hatch fill palette settings to set. |
Returns:
anychart.charts.Cartesian - Self instance for method chaining.Try it:
height
Returns:
number | string | undefined - Chart's height setting.var chart = anychart.cartesian(); chart.line([10, 4, 17, 20, 16, 35, 6, 15]); var height = chart.height();
Params:
| Name | Type | Default | Description |
|---|---|---|---|
| value | number | string | null | null | Height setting for the chart. |
Returns:
anychart.charts.Cartesian - Self instance for method chaining.Try it:
hilo
Params:
| Name | Type | Description |
|---|---|---|
| data | anychart.data.View | anychart.data.Set | Array | string | Data for the series. |
| csvSettings | anychart.enums.TextParsingMode | string | anychart.data.TextParsingSettings | If CSV string is passed, you can pass CSV parser settings here as a hash map. |
Returns:
anychart.core.cartesian.series.Hilo - An instance of the created series.Try it:
hovered
Returns:
anychart.core.StateSettings - Hovered state settingsTry it:
Params:
| Name | Type | Description |
|---|---|---|
| settings | Object | State settings to set. |
Returns:
anychart.charts.Cartesian - Self instance for method chaining.Try it:
id
Params:
| Name | Type | Description |
|---|---|---|
| id | string | Chart id. |
Returns:
anychart.charts.Cartesian - Self instance for method chaining.Try it:
inMarquee
Returns:
boolean - Returns true if there is a marquee process running.interactivity
Returns:
anychart.core.utils.Interactivity - Interactivity settings.Try it:
Params:
| Name | Type | Description |
|---|---|---|
| settings | Object | anychart.enums.HoverMode | string | Settings object or boolean value like enabled state. |
Returns:
anychart.charts.Cartesian - Self instance for method chaining.Try it:
isFullScreenAvailable
Returns:
boolean - isFullScreenAvailable state.Try it:
isVertical
Returns:
boolean - The flag of the series layout direction.var flag = chart.isVertical();
Params:
| Name | Type | Default | Description |
|---|---|---|---|
| enabled | boolean | null | false | Whether to change the chart layout direction to vertical. |
Returns:
anychart.charts.Cartesian - Self instance for method chaining.Try it:
jumpLine
Params:
| Name | Type | Description |
|---|---|---|
| data | anychart.data.View | anychart.data.Set | Array | string | Data for the series. |
| csvSettings | anychart.enums.TextParsingMode | string | anychart.data.TextParsingSettings | If CSV string is passed, you can pass CSV parser settings here as a hash map. |
Returns:
anychart.core.cartesian.series.JumpLine - An instance of the created series.Try it:
label
Params:
| Name | Type | Default | Description |
|---|---|---|---|
| index | string | number | 0 | Index of instance. |
Returns:
anychart.core.ui.Label - An instance of class.Try it:
- null/boolean - disable or enable chart label.
- string - sets chart label text value.
- object - sets chart label settings.
Params:
| Name | Type | Default | Description |
|---|---|---|---|
| settings | null | boolean | Object | string | false | Chart label instance to add by index 0. |
Returns:
anychart.charts.Cartesian - Self instance for method chaining.- null/boolean - disable or enable chart label.
- string - sets chart label text value.
- object - sets chart label settings.
Params:
| Name | Type | Default | Description |
|---|---|---|---|
| index | string | number | 0 | Label index. |
| settings | null | boolean | Object | string | false | Chart label settings. |
Returns:
anychart.charts.Cartesian - Self instance for method chaining.labels
- null/boolean - disable or enable chart labels.
- object - sets chart labels settings.
Params:
| Name | Type | Description |
|---|---|---|
| settings | Object | boolean | null | Series data labels settings. |
Returns:
anychart.charts.Cartesian - Self instance for method chaining.left
Returns:
number | string | undefined - Chart's left bound setting.var chart = anychart.cartesian(); chart.line([10, 4, 17, 20, 16, 35, 6, 15]); var left = chart.left();
Params:
| Name | Type | Default | Description |
|---|---|---|---|
| value | number | string | null | null | Left bound setting for the chart. |
Returns:
anychart.charts.Cartesian - Self instance for method chaining.Try it:
legend
- null/boolean - disable or enable chart legend.
- object - sets chart legend settings.
Params:
| Name | Type | Default | Description |
|---|---|---|---|
| settings | Object | boolean | null | false | Legend settings. |
Returns:
anychart.charts.Cartesian - An instance of the class for method chaining.line
Params:
| Name | Type | Description |
|---|---|---|
| data | anychart.data.View | anychart.data.Set | Array | string | Data for the series. |
| csvSettings | anychart.enums.TextParsingMode | string | anychart.data.TextParsingSettings | If CSV string is passed, you can pass CSV parser settings here as a hash map. |
Returns:
anychart.core.cartesian.series.Line - An instance of the created series.Try it:
lineMarker
Params:
| Name | Type | Default | Description |
|---|---|---|---|
| index | number | 0 | Chart line marker index. If not set - creates a new instance and adds it to the end of the array. |
Returns:
anychart.core.axisMarkers.Line - Line marker instance by index.Try it:
- null/boolean - disable or enable chart line marker.
- object - sets chart line marker settings.
Params:
| Name | Type | Default | Description |
|---|---|---|---|
| settings | Object | boolean | null | false | Chart line marker settings to set. |
Returns:
anychart.charts.Cartesian - Self instance for method chaining.- null/boolean - disable or enable chart line marker by index.
- object - sets chart line marker settings by index.
Params:
| Name | Type | Default | Description |
|---|---|---|---|
| index | number | 0 | Chart line marker index. |
| settings | Object | boolean | null | Chart line marker settings to set. |
Returns:
anychart.charts.Cartesian - Self instance for method chaining.listen
Note: Notice that if the existing listener is one-off (added using listenOnce), it will cease to be such after calling the listen() method.
Params:
| Name | Type | Default | Description |
|---|---|---|---|
| type | string | The event type id. | |
| listener | function(e:Object) | Callback method.
Function that looks like: function(event){
// event.actualTarget - actual event target
// event.currentTarget - current event target
// event.iterator - event iterator
// event.originalEvent - original event
// event.point - event point
// event.pointIndex - event point index
} | |
| useCapture | boolean | false | Whether to fire in capture phase. Learn more about capturing https://javascript.info/bubbling-and-capturing |
| listenerScope | Object | Object in whose scope to call the listener. |
Returns:
Object - Unique key for the listener.Try it:
listenOnce
If the event handler being added already exists, listenOnce will do nothing.
Note: In particular, if the handler is already registered using listen(), listenOnce() will not make it one-off. Similarly, if a one-off listener already exists, listenOnce will not change it (it wil remain one-off).
Params:
| Name | Type | Default | Description |
|---|---|---|---|
| type | string | The event type id. | |
| listener | function(e:Object) | Callback method. | |
| useCapture | boolean | false | Whether to fire in capture phase. Learn more about capturing https://javascript.info/bubbling-and-capturing |
| listenerScope | Object | Object in whose scope to call the listener. |
Returns:
Object - Unique key for the listener.Try it:
localToGlobal
On image below, the red point is a starting coordinate point of the chart bounds. Local coordinates work only in area of the stage (container).
Params:
| Name | Type | Description |
|---|---|---|
| xCoord | number | Local X coordinate. |
| yCoord | number | Local Y coordinate. |
Returns:
Object.<string, number> - Object with XY coordinates.Try it:
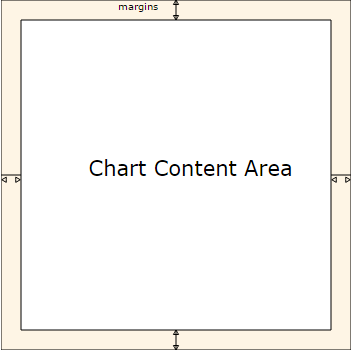
margin
Returns:
anychart.core.utils.Margin - Chart margin.Try it:
Params:
| Name | Type | Default | Description |
|---|---|---|---|
| margin | Array.<(number|string)> | Object | {top: 0, right: 0, bottom: 0, left: 0} | Value to set. |
Returns:
anychart.charts.Cartesian - Self instance for method chaining.// all margins 15px
chart.margin(15);
// all margins 15px
chart.margin("15px");
// top and bottom 5px, right and left 15px
chart.margin(anychart.utils.margin(5, 15));Try it:
Params:
| Name | Type | Default | Description |
|---|---|---|---|
| value1 | string | number | 0 | Top or top-bottom space. |
| value2 | string | number | 0 | Right or right-left space. |
| value3 | string | number | 0 | Bottom space. |
| value4 | string | number | 0 | Left space. |
Returns:
anychart.charts.Cartesian - Self instance for method chaining.// 1) all 10px chart.margin(10); // 2) top and bottom 10px, left and right 15px chart.margin(10, "15px"); // 3) top 10px, left and right 15px, bottom 5px chart.margin(10, "15px", 5); // 4) top 10px, right 15px, bottom 5px, left 12px chart.margin(10, "15px", "5px", 12);
Try it:
marker
Params:
| Name | Type | Description |
|---|---|---|
| data | anychart.data.View | anychart.data.Set | Array | string | Data for the series. |
| csvSettings | anychart.enums.TextParsingMode | string | anychart.data.TextParsingSettings | If CSV string is passed, you can pass CSV parser settings here as a hash map. |
Returns:
anychart.core.cartesian.series.Marker - An instance of the created series.Try it:
markerPalette
Returns:
anychart.palettes.Markers - Chart markers palette.Try it:
Params:
| Name | Type | Description |
|---|---|---|
| settings | anychart.palettes.Markers | Object | Array.<(anychart.enums.MarkerType|string)> | Chart marker palette settings to set. |
Returns:
anychart.charts.Cartesian - Self instance for method chaining.Try it:
maxBubbleSize
Returns:
number | string - Maximum size all of the bubbles.Try it:
Params:
| Name | Type | Default | Description |
|---|---|---|---|
| size | number | string | '20%' | Maximum size to set. |
Returns:
anychart.charts.Cartesian - Self instance for method chaining.Try it:
maxHeight
Returns:
number | string | null - Chart's maximum height.var chart = anychart.cartesian(); chart.line([10, 4, 17, 20, 16, 35, 6, 15]); var maxHeight = chart.maxHeight();
Params:
| Name | Type | Default | Description |
|---|---|---|---|
| value | number | string | null | null | Value to set. |
Returns:
anychart.charts.Cartesian - Self instance for method chaining.Try it:
maxLabels
- null/boolean - disable or enable maximum labels.
- object - sets maximum labels settings.
Params:
| Name | Type | Description |
|---|---|---|
| settings | Object | boolean | null | Maximum labels settings. |
Returns:
anychart.charts.Cartesian - Self instance for method chaining.maxPointWidth
Returns:
string | number - The maximum point width pixel value.var maxPointWidth = chart.maxPointWidth();
Params:
| Name | Type | Description |
|---|---|---|
| maxWidth | number | string | Point width pixel value. |
Returns:
anychart.charts.Cartesian - Self instance for method chaining.Try it:
maxWidth
Returns:
number | string | null - Chart's maximum width.var chart = anychart.cartesian(); chart.line([10, 4, 17, 20, 16, 35, 6, 15]); var maxWidth = chart.maxWidth();
Params:
| Name | Type | Default | Description |
|---|---|---|---|
| value | number | string | null | null | Value to set. |
Returns:
anychart.charts.Cartesian - Self instance for method chaining.Try it:
minBubbleSize
Returns:
number | string - Minimum size of the all bubbles.Try it:
Params:
| Name | Type | Default | Description |
|---|---|---|---|
| size | number | string | '5%' | Minimum size to set. |
Returns:
anychart.charts.Cartesian - Self instance for method chaining.Try it:
minHeight
Returns:
number | string | null - Chart's minimum height.var chart = anychart.cartesian(); chart.line([10, 4, 17, 20, 16, 35, 6, 15]); var minHeight = chart.minHeight();
Params:
| Name | Type | Default | Description |
|---|---|---|---|
| value | number | string | null | null | Value to set. |
Returns:
anychart.charts.Cartesian - Self instance for method chaining.Try it:
minLabels
- null/boolean - disable or enable minimum labels.
- object - sets minimum labels settings.
Params:
| Name | Type | Description |
|---|---|---|
| settings | Object | boolean | null | Minimum labels settings. |
Returns:
anychart.charts.Cartesian - Self instance for method chaining.minPointLength
Returns:
string | number - The minimum point length pixel value.var minPointLength = chart.minPointLength();
Params:
| Name | Type | Description |
|---|---|---|
| length | number | string | Minimum point length pixel value. |
Returns:
anychart.charts.Cartesian - Self instance for method chaining.Try it:
minWidth
Returns:
number | string | null - Chart's minimum width.var chart = anychart.cartesian(); chart.line([10, 4, 17, 20, 16, 35, 6, 15]); var minWidth = chart.minWidth();
Params:
| Name | Type | Default | Description |
|---|---|---|---|
| value | number | string | null | null | Value to set. |
Returns:
anychart.charts.Cartesian - Self instance for method chaining.Try it:
noData
Learn more about "No data" feature
Params:
| Name | Type | Description |
|---|---|---|
| settings | Object | NoData settings. |
Returns:
anychart.charts.Cartesian - Self instance for method chaining.Try it:
normal
Returns:
anychart.core.StateSettings - Normal state settings.Try it:
Params:
| Name | Type | Description |
|---|---|---|
| settings | Object | State settings to set. |
Returns:
anychart.charts.Cartesian - Self instance for method chaining.Try it:
ohlc
Params:
| Name | Type | Description |
|---|---|---|
| data | anychart.data.View | anychart.data.Set | Array | string | Data for the series. |
| csvSettings | anychart.enums.TextParsingMode | string | anychart.data.TextParsingSettings | If CSV string is passed, you can pass CSV parser settings here as a hash map. |
Returns:
anychart.core.cartesian.series.OHLC - An instance of the created series.Try it:
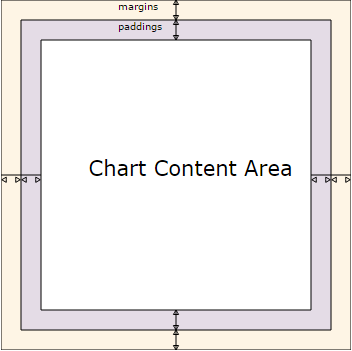
padding
Returns:
anychart.core.utils.Padding - Chart padding.Try it:
Params:
| Name | Type | Default | Description |
|---|---|---|---|
| padding | Array.<(number|string)> | Object | {top: 0, right: 0, bottom: 0, left: 0} | Value to set. |
Returns:
anychart.charts.Cartesian - Self instance for method chaining.chart.padding([5, 15]);
or
chart.padding({left: 10, top: 20, bottom: 30, right: "40%"}});Try it:
Params:
| Name | Type | Default | Description |
|---|---|---|---|
| value1 | string | number | 0 | Top or top-bottom space. |
| value2 | string | number | 0 | Right or right-left space. |
| value3 | string | number | 0 | Bottom space. |
| value4 | string | number | 0 | Left space. |
Returns:
anychart.charts.Cartesian - Self instance for method chaining.// 1) all 10px chart.padding(10); // 2) top and bottom 10px, left and right 15px chart.padding(10, "15px"); // 3) top 10px, left and right 15px, bottom 5px chart.padding(10, "15px", 5); // 4) top 10px, right 15%, bottom 5px, left 12px chart.padding(10, "15%", "5px", 12);
Try it:
palette
Try it:
Params:
| Name | Type | Description |
|---|---|---|
| settings | anychart.palettes.RangeColors | anychart.palettes.DistinctColors | Object | Array.<string> | Chart colors palette settings to set. |
Returns:
anychart.charts.Cartesian - Self instance for method chaining.pointWidth
Returns:
string | number - The point width pixel value.var pointWidth = chart.pointWidth();
Params:
| Name | Type | Description |
|---|---|---|
| width | number | string | Point width pixel value. |
Returns:
anychart.charts.Cartesian - Self instance for method chaining.Try it:
Params:
| Name | Type | Default | Description |
|---|---|---|---|
| paperSize | anychart.graphics.vector.PaperSize | Paper size. | |
| landscape | boolean | false | Flag of landscape. |
Try it:
rangeArea
Params:
| Name | Type | Description |
|---|---|---|
| data | anychart.data.View | anychart.data.Set | Array | string | Data for the series. |
| csvSettings | anychart.enums.TextParsingMode | string | anychart.data.TextParsingSettings | If CSV string is passed, you can pass CSV parser settings here as a hash map. |
Returns:
anychart.core.cartesian.series.RangeArea - An instance of the created series.Try it:
rangeBar
Params:
| Name | Type | Description |
|---|---|---|
| data | anychart.data.View | anychart.data.Set | Array | string | Data for the series. |
| csvSettings | anychart.enums.TextParsingMode | string | anychart.data.TextParsingSettings | If CSV string is passed, you can pass CSV parser settings here as a hash map. |
Returns:
anychart.core.cartesian.series.RangeBar - An instance of the created series.Try it:
rangeColumn
Params:
| Name | Type | Description |
|---|---|---|
| data | anychart.data.View | anychart.data.Set | Array | string | Data for the series. |
| csvSettings | anychart.enums.TextParsingMode | string | anychart.data.TextParsingSettings | If CSV string is passed, you can pass CSV parser settings here as a hash map. |
Returns:
anychart.core.cartesian.series.RangeColumn - An instance of the created series.Try it:
rangeMarker
Params:
| Name | Type | Default | Description |
|---|---|---|---|
| index | number | 0 | Chart range marker index. If not set - creates a new instance and adds it to the end of the array. |
Returns:
anychart.core.axisMarkers.Range - Range marker instance by index.Try it:
- null/boolean - disable or enable chart range marker.
- object - sets chart range marker settings.
Params:
| Name | Type | Default | Description |
|---|---|---|---|
| settings | Object | boolean | null | false | Chart range marker settings to set. |
Returns:
anychart.charts.Cartesian - Self instance for method chaining.- null/boolean - disable or enable chart range marker by index.
- object - sets chart range marker settings by index.
Params:
| Name | Type | Default | Description |
|---|---|---|---|
| index | number | 0 | Chart range marker index. |
| settings | Object | boolean | null | Chart range marker settings to set. |
Returns:
anychart.charts.Cartesian - Self instance for method chaining.rangeSplineArea
Params:
| Name | Type | Description |
|---|---|---|
| data | anychart.data.View | anychart.data.Set | Array | string | Data for the series. |
| csvSettings | anychart.enums.TextParsingMode | string | anychart.data.TextParsingSettings | If CSV string is passed, you can pass CSV parser settings here as a hash map. |
Returns:
anychart.core.cartesian.series.RangeSplineArea - An instance of the created series.Try it:
rangeStepArea
Params:
| Name | Type | Description |
|---|---|---|
| data | anychart.data.View | anychart.data.Set | Array | string | Data for the series. |
| csvSettings | anychart.enums.TextParsingMode | string | anychart.data.TextParsingSettings | If CSV string is passed, you can pass CSV parser settings here as a hash map. |
Returns:
anychart.core.cartesian.series.RangeStepArea - An instance of the created series.Try it:
removeAllListeners
Params:
| Name | Type | Description |
|---|---|---|
| type | string | Type of event to remove, default is to remove all types. |
Returns:
number - Number of listeners removed.Try it:
removeAllSeries
Returns:
anychart.charts.Cartesian - Self instance for method chaining.Try it:
removeSeries
Params:
| Name | Type | Description |
|---|---|---|
| id | number | string | Series id. |
Returns:
anychart.charts.Cartesian - Self instance for method chaining.Try it:
removeSeriesAt
Params:
| Name | Type | Description |
|---|---|---|
| index | number | Series index. |
Returns:
anychart.charts.Cartesian - Self instance for method chaining.Try it:
right
Returns:
number | string | undefined - Chart's right bound setting.var chart = anychart.cartesian(); chart.line([10, 4, 17, 20, 16, 35, 6, 15]); var right = chart.right();
Params:
| Name | Type | Default | Description |
|---|---|---|---|
| value | number | string | null | null | Right bound setting for the chart. |
Returns:
anychart.charts.Cartesian - Self instance for method chaining.Try it:
saveAsCsv
Params:
| Name | Type | Description |
|---|---|---|
| chartDataExportMode | anychart.enums.ChartDataExportMode | string | Data export mode. |
| csvSettings | Object.<string, (string|boolean|undefined|function(name:*, value:*))> | CSV settings object:
Formatters must be represented as one of:
|
| filename | string | File name to save. |
Try it:
saveAsJpg
Params:
| Name | Type | Description |
|---|---|---|
| width | number | Image width. |
| height | number | Image height. |
| quality | number | Image quality in ratio 0-1. |
| forceTransparentWhite | boolean | Define, should we force transparent to white background. |
| filename | string | File name to save. |
Try it:
saveAsJson
Params:
| Name | Type | Description |
|---|---|---|
| filename | string | File name to save. |
Try it:
saveAsPdf
Params:
| Name | Type | Description |
|---|---|---|
| paperSize | string | Any paper format like 'a0', 'tabloid', 'b4', etc. |
| landscape | boolean | Define, is landscape. |
| x | number | Offset X. |
| y | number | Offset Y. |
| filename | string | File name to save. |
Try it:
saveAsPng
Params:
| Name | Type | Description |
|---|---|---|
| width | number | Image width. |
| height | number | Image height. |
| quality | number | Image quality in ratio 0-1. |
| filename | string | File name to save. |
Try it:
saveAsSvg
Params:
| Name | Type | Description |
|---|---|---|
| paperSize | string | Paper Size. |
| landscape | boolean | Landscape. |
| filename | string | File name to save. |
Try it:
Params:
| Name | Type | Description |
|---|---|---|
| width | number | Image width. |
| height | number | Image height. |
Try it:
saveAsXlsx
Params:
| Name | Type | Description |
|---|---|---|
| chartDataExportMode | anychart.enums.ChartDataExportMode | string | Data export mode. |
| filename | string | File name to save. |
| exportOptions | Object.<string, (function(name:*, value:*))> | Export options:
Formatter must be represented as one of:
|
Try it:
saveAsXml
Params:
| Name | Type | Description |
|---|---|---|
| filename | string | File name to save. |
Try it:
selectRectangleMarqueeFill
Returns:
anychart.graphics.vector.Fill - Select marquee fill.var selectRectangleMarqueeFill = chart.selectRectangleMarqueeFill();
Params:
| Name | Type | Description |
|---|---|---|
| color | anychart.graphics.vector.Fill | Array.<(anychart.graphics.vector.GradientKey|string)> | Color as an object, an array or a string. |
Returns:
anychart.charts.Cartesian - Self instance for method chaining.Params:
| Name | Type | Description |
|---|---|---|
| color | string | Color as a string. |
| opacity | number | Color opacity. |
Returns:
anychart.charts.Cartesian - Self instance for method chaining.Try it:
Params:
| Name | Type | Description |
|---|---|---|
| keys | Array.<(anychart.graphics.vector.GradientKey|string)> | Gradient keys. |
| angle | number | Gradient angle. |
| mode | boolean | anychart.graphics.vector.Rect | Object | Gradient mode. |
| opacity | number | Gradient opacity. |
Returns:
anychart.charts.Cartesian - Self instance for method chaining.Try it:
Params:
| Name | Type | Description |
|---|---|---|
| keys | Array.<(anychart.graphics.vector.GradientKey|string)> | Color-stop gradient keys. |
| cx | number | X ratio of center radial gradient. |
| cy | number | Y ratio of center radial gradient. |
| mode | anychart.graphics.math.Rect | If defined then userSpaceOnUse mode, else objectBoundingBox. |
| opacity | number | Opacity of the gradient. |
| fx | number | X ratio of focal point. |
| fy | number | Y ratio of focal point. |
Returns:
anychart.charts.Cartesian - Self instance for method chaining.Try it:
Params:
| Name | Type | Description |
|---|---|---|
| imageSettings | anychart.graphics.vector.Fill | Object with settings. |
Returns:
anychart.charts.Cartesian - Self instance for method chaining.Try it:
selectRectangleMarqueeStroke
Returns:
anychart.graphics.vector.Stroke - Select marquee stroke.var selectRectangleMarqueeStroke = chart.selectRectangleMarqueeStroke();
Params:
| Name | Type | Default | Description |
|---|---|---|---|
| color | anychart.graphics.vector.Stroke | anychart.graphics.vector.ColoredFill | string | null | Stroke settings. | |
| thickness | number | 1 | Line thickness. |
| dashpattern | string | Controls the pattern of dashes and gaps used to stroke paths. | |
| lineJoin | string | anychart.graphics.vector.StrokeLineJoin | Line join style. | |
| lineCap | string | anychart.graphics.vector.StrokeLineCap | Line cap style. |
Returns:
anychart.charts.Cartesian - Self instance for method chaining.Try it:
selected
Returns:
anychart.core.StateSettings - Selected state settingsTry it:
Params:
| Name | Type | Description |
|---|---|---|
| settings | Object | State settings to set. |
Returns:
anychart.charts.Cartesian - Self instance for method chaining.Try it:
shareAsJpg
shareAsPdf
shareAsPng
shareAsSvg
shareWithFacebook
shareWithLinkedIn
shareWithPinterest
shareWithTwitter
spline
Params:
| Name | Type | Description |
|---|---|---|
| data | anychart.data.View | anychart.data.Set | Array | string | Data for the series. |
| csvSettings | anychart.enums.TextParsingMode | string | anychart.data.TextParsingSettings | If CSV string is passed, you can pass CSV parser settings here as a hash map. |
Returns:
anychart.core.cartesian.series.Spline - An instance of the created series.Try it:
splineArea
Params:
| Name | Type | Description |
|---|---|---|
| data | anychart.data.View | anychart.data.Set | Array | string | Data for the series. |
| csvSettings | anychart.enums.TextParsingMode | string | anychart.data.TextParsingSettings | If CSV string is passed, you can pass CSV parser settings here as a hash map. |
Returns:
anychart.core.cartesian.series.SplineArea - An instance of the created series.Try it:
startSelectRectangleMarquee
Params:
| Name | Type | Description |
|---|---|---|
| repeat | boolean | Whether to start select marquee drawing. |
Returns:
anychart.charts.Cartesian - Self instance for method chaining.Try it:
stepArea
Params:
| Name | Type | Description |
|---|---|---|
| data | anychart.data.View | anychart.data.Set | Array | string | Data for the series. |
| csvSettings | anychart.enums.TextParsingMode | string | anychart.data.TextParsingSettings | If CSV string is passed, you can pass CSV parser settings here as a hash map. |
Returns:
anychart.core.cartesian.series.StepArea - An instance of the created series.Try it:
stepLine
Params:
| Name | Type | Description |
|---|---|---|
| data | anychart.data.View | anychart.data.Set | Array | string | Data for the series. |
| csvSettings | anychart.enums.TextParsingMode | string | anychart.data.TextParsingSettings | If CSV string is passed, you can pass CSV parser settings here as a hash map. |
Returns:
anychart.core.cartesian.series.StepLine - An instance of the created series.Try it:
stick
Params:
| Name | Type | Description |
|---|---|---|
| data | anychart.data.View | anychart.data.Set | Array | string | Data for the series. |
| csvSettings | anychart.enums.TextParsingMode | string | anychart.data.TextParsingSettings | If CSV string is passed, you can pass CSV parser settings here as a hash map. |
Returns:
anychart.core.cartesian.series.Stick - An instance of the created series.Try it:
textMarker
Params:
| Name | Type | Default | Description |
|---|---|---|---|
| index | number | 0 | Chart text marker index. If not set - creates a new instance and adds it to the end of the array. |
Returns:
anychart.core.axisMarkers.Text - Text marker instance by index.Try it:
- null/boolean - disable or enable chart text marker.
- object - sets chart text marker settings.
Params:
| Name | Type | Default | Description |
|---|---|---|---|
| settings | Object | boolean | null | false | Chart text marker settings to set. |
Returns:
anychart.charts.Cartesian - Self instance for method chaining.- null/boolean - disable or enable chart text marker by index.
- object - sets chart text marker settings by index.
Params:
| Name | Type | Default | Description |
|---|---|---|---|
| index | number | 0 | Chart text marker index. |
| settings | Object | boolean | null | Chart text marker settings to set. |
Returns:
anychart.charts.Cartesian - Self instance for method chaining.title
- null/boolean - disable or enable chart title.
- string - sets chart title text value.
- object - sets chart title settings.
Params:
| Name | Type | Default | Description |
|---|---|---|---|
| settings | null | boolean | Object | string | false | Chart title text or title instance for copy settings from. |
Returns:
anychart.charts.Cartesian - Self instance for method chaining.toA11yTable
Params:
| Name | Type | Description |
|---|---|---|
| title | string | Title to set. |
| asString | boolean | Defines output: HTML string if True, DOM element if False. |
Returns:
Element | string | null - HTML table instance with a11y style (invisible), HTML string or null if parsing chart to table fails.Try it:
toCsv
Params:
| Name | Type | Description |
|---|---|---|
| chartDataExportMode | anychart.enums.ChartDataExportMode | string | Data export mode. |
| csvSettings | Object.<string, (string|boolean|undefined|function(name:*, value:*)|Object)> | CSV settings. CSV settings object: rowsSeparator - string or undefined (default is '\n') columnsSeparator - string or undefined (default is ',') ignoreFirstRow - boolean or undefined (default is 'false') formats - 1) a function with two arguments such as the field name and value, that returns the formatted value or 2) the object with the key as the field name, and the value as a format function. (default is 'undefined'). |
Returns:
string - CSV string.Try it:
toHtmlTable
Params:
| Name | Type | Description |
|---|---|---|
| title | string | Title to set. |
| asString | boolean | Defines output: HTML string if True, DOM element if False. |
Returns:
Element | string | null - HTML table instance, HTML string or null if parsing chart to table fails.Try it:
toJson
Params:
| Name | Type | Default | Description |
|---|---|---|---|
| stringify | boolean | false | Returns JSON as string. |
Returns:
Object | string - Chart configuration.toSvg
Params:
| Name | Type | Description |
|---|---|---|
| paperSize | string | Paper Size. |
| landscape | boolean | Landscape. |
Returns:
string - SVG content or empty string.Try it:
Params:
| Name | Type | Description |
|---|---|---|
| width | number | Image width. |
| height | number | Image height. |
Returns:
string - SVG content or empty string.Try it:
toXml
Params:
| Name | Type | Default | Description |
|---|---|---|---|
| asXmlNode | boolean | false | Return XML as XMLNode. |
Returns:
string | Node - Chart configuration.tooltip
Returns:
anychart.core.ui.Tooltip - Tooltip settings.var tooltip = chart.tooltip();
- null/boolean - disable or enable tooltip.
- object - sets tooltip settings.
Params:
| Name | Type | Default | Description |
|---|---|---|---|
| settings | Object | boolean | null | false | Chart tooltip settings. |
Returns:
anychart.charts.Cartesian - Self instance for method chaining.top
Returns:
number | string | undefined - Chart's top bound setting.var chart = anychart.cartesian(); chart.line([10, 4, 17, 20, 16, 35, 6, 15]); var top = chart.top();
Params:
| Name | Type | Default | Description |
|---|---|---|---|
| value | number | string | null | null | Top bound setting for the chart. |
Returns:
anychart.charts.Cartesian - Self instance for method chaining.Try it:
unlisten
Params:
| Name | Type | Default | Description |
|---|---|---|---|
| type | string | The event type id. | |
| listener | function(e:Object) | Callback method. | |
| useCapture | boolean | false | Whether to fire in capture phase. Learn more about capturing https://javascript.info/bubbling-and-capturing |
| listenerScope | Object | Object in whose scope to call the listener. |
Returns:
boolean - Whether any listener was removed.Try it:
unlistenByKey
Params:
| Name | Type | Description |
|---|---|---|
| key | Object | The key returned by listen() or listenOnce(). |
Returns:
boolean - Whether any listener was removed.Try it:
width
Returns:
number | string | undefined - Chart's width setting.var chart = anychart.cartesian(); chart.line([10, 4, 17, 20, 16, 35, 6, 15]); var width = chart.width();
Params:
| Name | Type | Default | Description |
|---|---|---|---|
| value | number | string | null | null | Width settings for the chart. |
Returns:
anychart.charts.Cartesian - Self instance for method chaining.Try it:
xAxis
Params:
| Name | Type | Default | Description |
|---|---|---|---|
| index | number | 0 | Chart axis index. If not set - creates a new instance and adds it to the end of the array. |
Returns:
anychart.core.axes.Linear - Axis instance by index.Try it:
- null/boolean - disable or enable chart X-axis.
- object - sets chart X-axis settings.
Params:
| Name | Type | Description |
|---|---|---|
| settings | Object | boolean | null | Chart axis settings to set. |
Returns:
anychart.charts.Cartesian - Self instance for method chaining.- null/boolean - disable or enable chart X-axis by index.
- object - sets chart X-axis settings by index.
Params:
| Name | Type | Default | Description |
|---|---|---|---|
| index | number | 0 | Chart axis index. |
| settings | Object | boolean | null | Chart axis settings to set. |
Returns:
anychart.charts.Cartesian - Self instance for method chaining.xGrid
Params:
| Name | Type | Default | Description |
|---|---|---|---|
| index | number | 0 | Chart grid index. If not set - creates a new instance and adds it to the end of the array. |
Returns:
anychart.core.grids.Linear - Grid instance by index.Try it:
- null/boolean - disable or enable chart xGrid.
- object - sets chart xGrid settings.
Params:
| Name | Type | Default | Description |
|---|---|---|---|
| settings | Object | boolean | null | false | Chart grid settings to set. |
Returns:
anychart.charts.Cartesian - Self instance for method chaining.- null/boolean - disable or enable chart xGrid by index.
- object - sets chart xGrid settings by index.
Params:
| Name | Type | Default | Description |
|---|---|---|---|
| index | number | 0 | Chart grid index. |
| settings | Object | boolean | null | false | Chart grid settings to set. |
Returns:
anychart.charts.Cartesian - Self instance for method chaining.xMinorGrid
Params:
| Name | Type | Default | Description |
|---|---|---|---|
| index | number | 0 | Chart minor grid index. If not set - creates a new instance and adds it to the end of the array. |
Returns:
anychart.core.grids.Linear - Minor grid instance by index.- null/boolean - disable or enable chart minor grid.
- object - sets chart minor grid settings.
Params:
| Name | Type | Default | Description |
|---|---|---|---|
| settings | Object | boolean | null | false | Chart minor grid settings to set. |
Returns:
anychart.charts.Cartesian - Self instance for method chaining.- null/boolean - disable or enable chart minor grid by index.
- object - sets chart minor grid settings by index.
Params:
| Name | Type | Default | Description |
|---|---|---|---|
| index | number | 0 | Chart minor grid index. |
| settings | Object | boolean | null | false | Chart minor grid settings to set. |
Returns:
anychart.charts.Cartesian - Self instance for method chaining.xScale
Params:
| Name | Type | Default | Description |
|---|---|---|---|
| settings | Object | anychart.enums.ScaleTypes | string | anychart.scales.Base | anychart.scales.Ordinal | X-scale to set. |
Returns:
anychart.charts.Cartesian - Self instance for method chaining.Try it:
xScroller
- null/boolean - disable or enable chart scroller.
- object - sets chart scroller settings.
Params:
| Name | Type | Description |
|---|---|---|
| settings | Object | boolean | null | Chart scroller settings. |
Returns:
anychart.charts.Cartesian - Self instance for method chaining.xZoom
Params:
| Name | Type | Description |
|---|---|---|
| settings | number | boolean | null | Object | Value to set. If you will pass null, true, false or number less than 1, then value will be converted in 1. |
Returns:
anychart.charts.Cartesian - Self instance for method chaining.Try it:
yAxis
Params:
| Name | Type | Default | Description |
|---|---|---|---|
| index | number | 0 | Chart axis index. If not set - creates a new instance and adds it to the end of the array. |
Returns:
anychart.core.axes.Linear - Axis instance by index.Try it:
Sets chart Y-axis settings depending on parameter type:
- null/boolean - disable or enable chart Y-axis.
- object - sets chart Y-axis settings.
Params:
| Name | Type | Description |
|---|---|---|
| settings | Object | boolean | null | Chart axis settings to set. |
Returns:
anychart.charts.Cartesian - Self instance for method chaining.- null/boolean - disable or enable chart Y-axis by index.
- object - sets chart Y-axis settings by index.
Params:
| Name | Type | Default | Description |
|---|---|---|---|
| index | number | 0 | Chart axis index. |
| settings | Object | boolean | null | Chart axis settings to set. |
Returns:
anychart.charts.Cartesian - Self instance for method chaining.yGrid
Params:
| Name | Type | Default | Description |
|---|---|---|---|
| index | number | 0 | Chart grid index. If not set - creates a new instance and adds it to the end of the array. |
Returns:
anychart.core.grids.Linear - Grid instance by index.Try it:
- null/boolean - disable or enable chart yGrid.
- object - sets chart yGrid settings.
Params:
| Name | Type | Default | Description |
|---|---|---|---|
| settings | Object | boolean | null | false | Chart grid settings to set. |
Returns:
anychart.charts.Cartesian - Self instance for method chaining.- null/boolean - disable or enable chart yGrid by index.
- object - sets chart yGrid settings by index.
Params:
| Name | Type | Default | Description |
|---|---|---|---|
| index | number | 0 | Chart grid index. |
| settings | Object | boolean | null | false | Chart grid settings to set. |
Returns:
anychart.charts.Cartesian - Self instance for method chaining.yMinorGrid
Params:
| Name | Type | Default | Description |
|---|---|---|---|
| index | number | 0 | Chart minor grid index. If not set - creates a new instance and adds it to the end of the array. |
Returns:
anychart.core.grids.Linear - Minor grid instance by index.Try it:
- null/boolean - disable or enable chart minor grid.
- object - sets chart minor grid settings.
Params:
| Name | Type | Default | Description |
|---|---|---|---|
| settings | Object | boolean | null | false | Chart minor grid settings to set. |
Returns:
anychart.charts.Cartesian - Self instance for method chaining.- null/boolean - disable or enable chart minor grid by index.
- object - sets chart minor grid settings by index.
Params:
| Name | Type | Default | Description |
|---|---|---|---|
| index | number | 0 | Chart minor grid index. |
| settings | Object | boolean | null | false | Chart minor grid settings to set. |
Returns:
anychart.charts.Cartesian - Self instance for method chaining.yScale
Params:
| Name | Type | Default | Description |
|---|---|---|---|
| settings | Object | anychart.enums.ScaleTypes | string | anychart.scales.Base | anychart.scales.Linear | Y-scale settings to set. |
Returns:
anychart.charts.Cartesian - Self instance for method chaining.Try it:
yScroller
- null/boolean - disable or enable Y scroller.
- object - sets Y scroller settings.
Params:
| Name | Type | Description |
|---|---|---|
| settings | Object | boolean | null | Chart Y scroller settings. |
Returns:
anychart.charts.Cartesian - Self instance for method chaining.yZoom
Params:
| Name | Type | Description |
|---|---|---|
| settings | number | boolean | null | Object | Zoom settings to set. If you pass null, true, false or a number less than 1, then the value is converted to 1. |
Returns:
anychart.charts.Cartesian - Self instance for method chaining.Try it:
zIndex
Returns:
number - Chart Z-index.var chart = anychart.line([1, 2, 3, 4], [2, 3, 4, 1], [3, 4, 1, 2], [4, 1, 2, 3]); var zIndex = chart.zIndex();
Params:
| Name | Type | Default | Description |
|---|---|---|---|
| zIndex | number | 0 | Value to set. |
Returns:
anychart.charts.Cartesian - Self instance for method chaining.Try it: