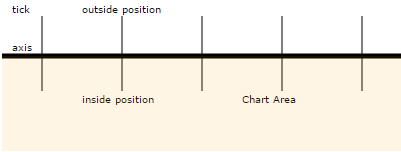
class anychart.core.axes.Ticks Improve this Doc
Extends: anychart.core.VisualBase
Axis ticks class.
You can change position, length and line features.
Methods Overview
| Coloring | |
| stroke() | Stroke settings. |
| Interactivity | |
| enabled() | Element state (enabled or disabled). |
| Size and Position | |
| length() | Ticks length. |
| position() | Ticks position. |
| zIndex() | Z-index of the element. |
Methods Description
enabled
Getter for the ticks state (enabled or disabled).
Returns:
boolean - Element state.Setter for the ticks enabled state.
Params:
| Name | Type | Description |
|---|---|---|
| enabled | boolean | Enabled state to set. |
Returns:
anychart.core.axes.Ticks - Self instance for method chaining. Example.
if (!element.enabled())
   element.enabled(true);
Try it:
length
Getter for ticks length.
Returns:
number - Length of ticks. See listing
var axisTicks = yAxis.ticks();
var ticksLength = axisTicks.length();
Setter for ticks length.


Params:
| Name | Type | Default | Description |
|---|---|---|---|
| length | number | 6 | Value to set. |
Returns:
anychart.core.axes.Ticks - Self instance for method chaining.Try it:
position
Getter for ticks position.
Returns:
anychart.enums.SidePosition | string - Ticks position. See listing
var axisTicks = yAxis.ticks();
var axisPosition = axisTicks.position();
Setter for ticks position.
You can set ticks inside of a chart area or outside its position.

You can set ticks inside of a chart area or outside its position.

Params:
| Name | Type | Default | Description |
|---|---|---|---|
| position | anychart.enums.SidePosition | string | 'outside' | Value to set. |
Returns:
anychart.core.axes.Ticks - Self instance for method chaining.Try it:
stroke
Getter for stroke settings.
Returns:
anychart.graphics.vector.Stroke - Returns stroke settings. See listing
var axisTicks = yAxis.ticks();
var ticksPosition = axisTicks.position();
Setter for stroke settings via single parameter.


Params:
| Name | Type | Default | Description |
|---|---|---|---|
| color | anychart.graphics.vector.Stroke | '#cecece' | Fill style as '[thickness ]color[ opacity]'. |
Returns:
anychart.core.axes.Ticks - Self instance for method chaining.Try it:
Setter for stroke settings via several parameter.
The following options are acceptable:
The following options are acceptable:
- String formatted as '[thickness ]color[ opacity]':
- 'color' - https://www.w3schools.com/html/html_colors.asp.
- 'thickness color' - like a CSS border, e.g. '3 red' or '3px red'
- 'color opacity' - as a fill string, e.g. '#fff 0.5'
- 'thickness color opacity' - as a complex string, e.g. '3px #00ff00 0.5'
- anychart.graphics.vector.Stroke object
- Keys array anychart.graphics.vector.GradientKey
- null - reset current stroke settings.
Params:
| Name | Type | Default | Description |
|---|---|---|---|
| color | string | Stroke color. | |
| thickness | number | 1 | Line thickness. |
| dashpattern | string | Controls the pattern of dashes and gaps used to stroke paths. | |
| lineJoin | string | anychart.graphics.vector.StrokeLineJoin | Line join style. | |
| lineCap | string | anychart.graphics.vector.StrokeLineCap | Line cap style. |
Returns:
anychart.core.axes.Ticks - Self instance for method chaining.Try it:
Setter for stroke settings using an object.
Params:
| Name | Type | Description |
|---|---|---|
| settings | Object | Object with stroke settings from anychart.graphics.vector.Stroke |
Returns:
anychart.core.axes.Ticks - Self instance for method chaining.Try it:
zIndex
Setter for the Z-index of the element.
Detailed description
The bigger the index - the higher the element position is.
Params:
| Name | Type | Default | Description |
|---|---|---|---|
| zIndex | number | 0 | Value to set. |
Returns:
anychart.core.axes.Ticks - Self instance for method chaining.Try it:
